Tomorrow I’ve got some fertilizer arriving, so I wanted to expand the manual event logging service so I can track the fertilizer application and other things as well.
Here is the first post about setting the service up.
And here is the repo on my GitHub.
In a nutshell, this is a Python script running as a service using Uvicorn and FastAPI to present HTML forms at the specified endpoints. When the form is submitted, the data is inserted into the appropriate table in the database.
Fertilizer Events
I’m going to just copy, paste, and modify some things that already exist from the snow event logging to make things easy. That includes the code in my app.py for my GET and POST methods. I’ll do the same for the HTML form.
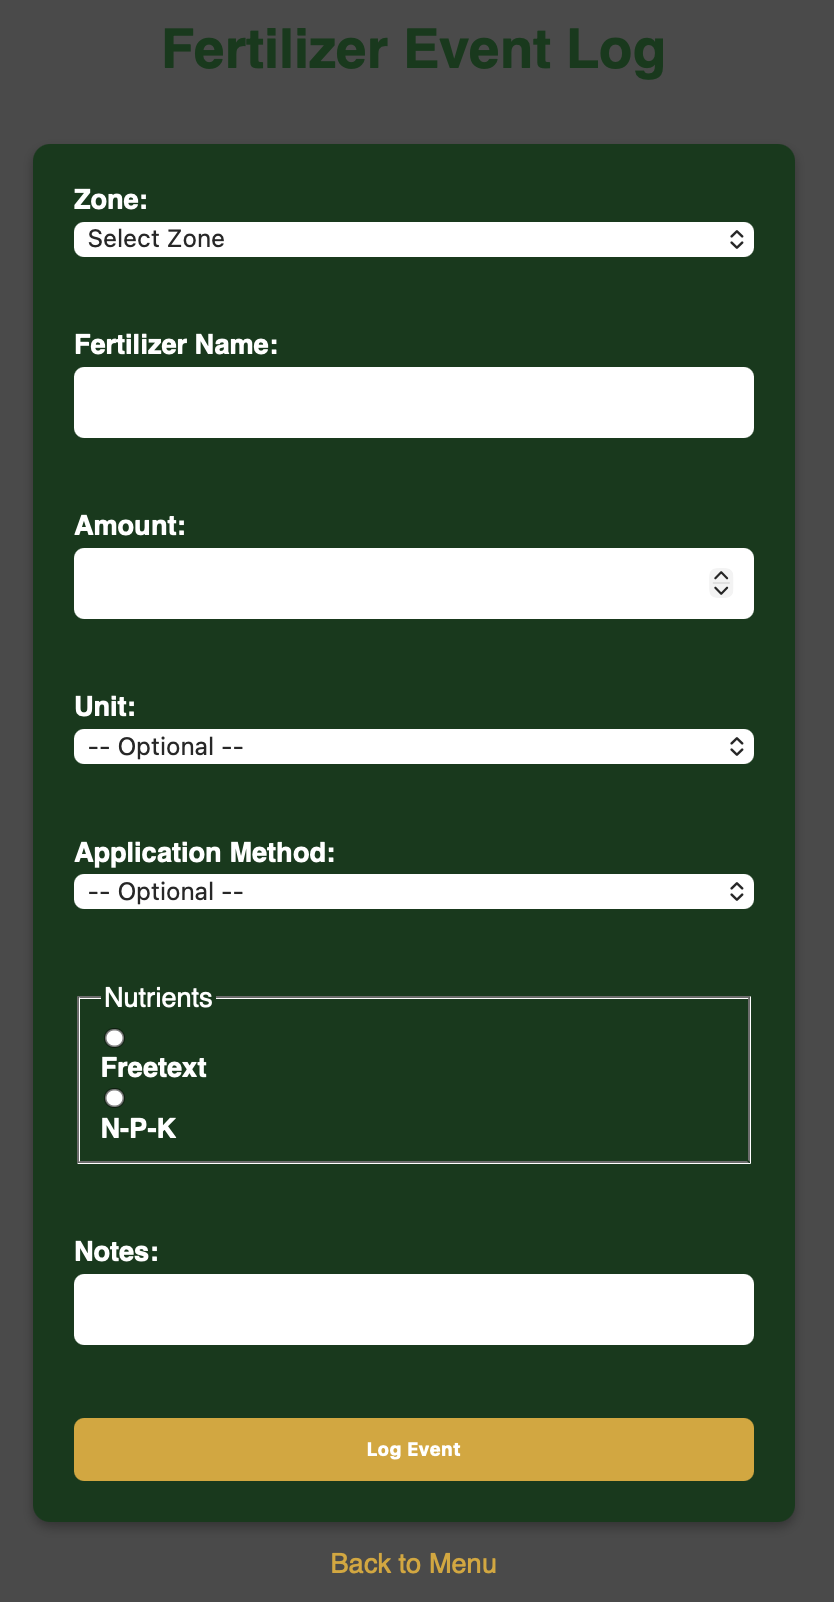
I’m going to track which zone the fertilizer is applied, the name of the fertilizer, how much fertilizer is used, the unit of measurement, application, nutrients, and I’ll include a notes field as well. The nutrients field has two options, with neither selected as default. Those options are to log as a free text field, or to log with Nitrogen, Phosphorus, and Potassium as their own values. The Timescale table reflects this option. Whichever option is selected, the other option is automatically NULL upon insertion to the table. Like the snow events logger, the timestamp for the row will be when the other data in the row is inserted.
Here’s the SQL to create the table:
CREATE TABLE manual.fertilizer_events (
id SERIAL PRIMARY KEY,
applied_at TIMESTAMPTZ DEFAULT NOW(),
zone TEXT NOT NULL,
fertilizer_name TEXT NOT NULL,
amount NUMERIC,
amount_unit TEXT,
application_method TEXT,
nutrients TEXT,
nitrogen NUMERIC,
phosphorus NUMERIC,
potassium NUMERIC,
notes TEXT
);
And here’s what the form looks like:
In time, I’ll make a similar endpoint to log soil pH, so I can track changes in pH over time based on fertilizer application and be able to tailor fertilizer application to address potential soil pH imbalances.
Disease & Pest Treatments
Aphids decided to attack my roses, and I thought that was unacceptable. I went to the store and bought an army of ladybugs to do battle with said aphids. So I created a table for that. Same method as before; copy, paste, modify. I set up another table in Timescale to hold the data:
CREATE TABLE manual.treatment_events (
id SERIAL PRIMARY KEY,
treated_at TIMESTAMPTZ DEFAULT NOW(),
zone TEXT NOT NULL,
treatment_type TEXT NOT NULL,
product_name TEXT NOT NULL,
target TEXT,
amount NUMERIC,
amount_unit TEXT,
application_method TEXT,
notes TEXT
);
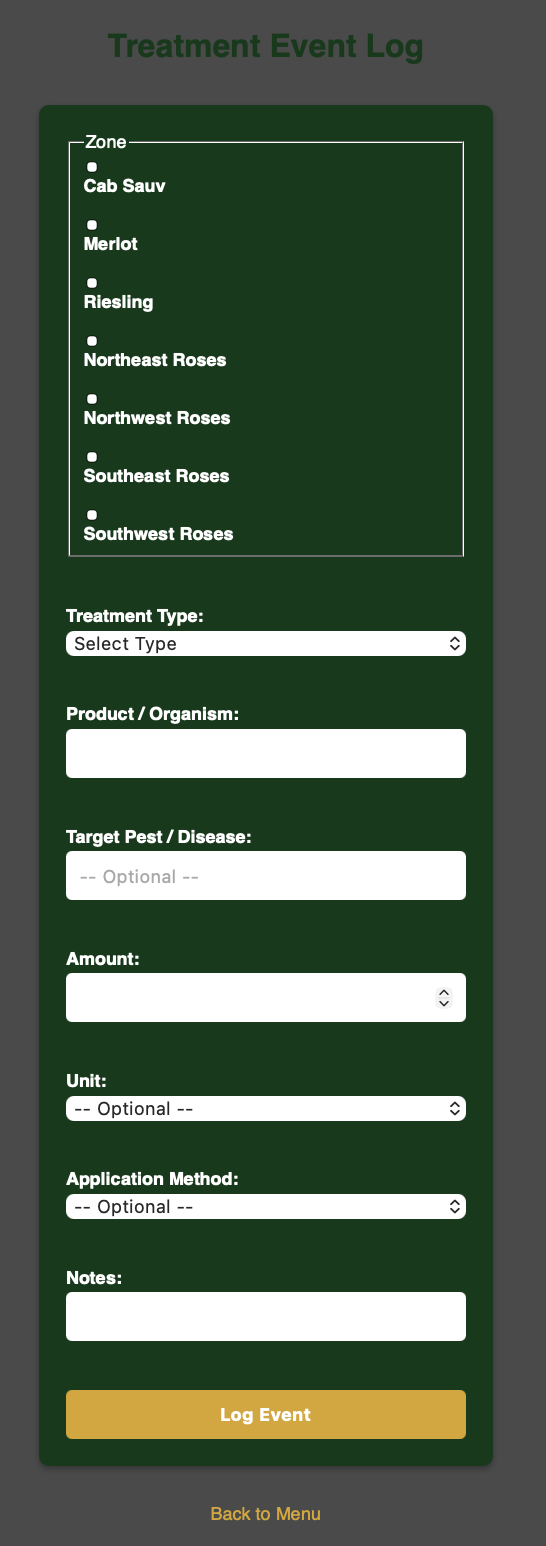
After that, I modified the app.py for GET and POST, then created my HTML form. Now I realized that when doing this or fertilizing, it would be very annoying to have to make individual entries for each zone. The solution was to create checkboxes for the zones, then make the zones a list. Loop through the list and insert a row into the table with identical data for each zone selected. I also went back and modified the fertilizer logger to function in the same manner. Here’s what the form looks like:
Grafana
As always, I need to visualize my data with dashboards in Grafana. I’m doing this so if I’m logging events with the forms from the yard on my phone, I don’t have to go inside to check the database directly with the laptop. I can submit my data via the form and see it appear instantly on Grafana.
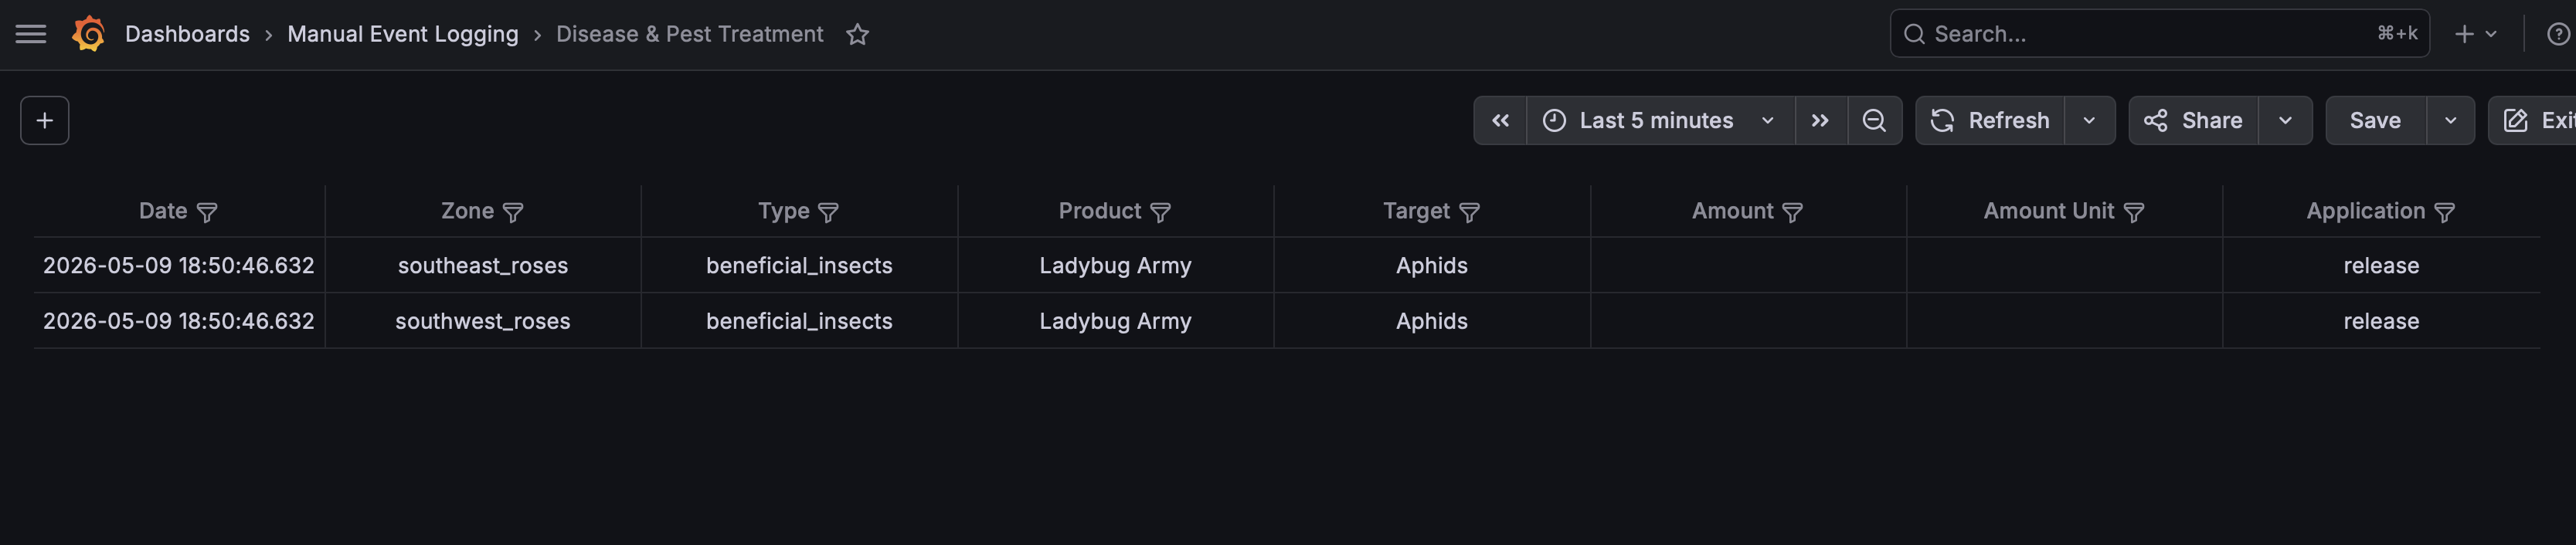
For now, since I’m waiting for the fertilizer to arrive tomorrow, I just did a simple SELECT * from the table in Grafana, I’ll refine it later when I have data to present. For the treatment, I entered the following query:
SELECT
treated_at as "Date",
zone as "Zone",
treatment_type as "Type",
product_name as "Product",
target as "Target",
amount as "Amount",
amount_unit as "Amount Unit",
application_method as "Application"
FROM manual.treatment_events ORDER BY treated_at DESC LIMIT 20;
That query gives me the following table:
Conclusion (For Now)
This process is pretty straightforward once you get the framework in place. It’s just copying and modifying what already exists to suit a different purpose. I have more manual event logging tables that I want to set up for things like pruning, irrigation maintenance, soil pH, or whatever else I think of down the road but those aren’t necessary yet. This pipeline though is proving to be useful and pretty flexible. It’s going to give me additional data and context that my sensors can’t detect and log.