Grafana is a tool that allows you to build dashboards to visualize data. I haven’t gone too deep into the full capabilities yet, but I wanted a way to display the weather data from my database without reinventing the wheel and building dashboards manually myself.
Install & Config
Grafana is available as an app on TrueNAS SCALE, which is the OS that runs on my NAS.
In the configuration, I’ll select “Publish port on the host for external access” for the Port Bind Mode in the network configuration so other hosts on my LAN can access the Grafana web UI with the default port 3000. Timescale and Portainer are using different ports, so I’ll have no conflicts between the three services and all can be accessed via their respective ports on the NAS IP (and hostname down the road when I get around to setting up Pi-hole). For the host IP, I’ll select ‘0.0.0.0’ (aka any) IP address because TrueNAS isn’t allowing me to select the host IP, but I’ve got traffic locked down pretty well with my VLAN and firewall rules setup.
For storage, I’m going to select “Host Path”, which will allow me to save data to a dataset outside of the container. I didn’t make the dataset prior to running the Grafana install, so it will likely give the same issue I had with Portainer where the app will crash until I change dataset ownership from root to apps. I was correct, so I’ll go fix the permissions issue on the dataset. So really, in the future, I should make my datasets before installing apps to avoid this issue. Now, with the dataset permissions corrected, I can run the app successfully.
I can now reach the login page and have found online that the default username and password are admin/admin. When I enter those values, I’m prompted to change the default password immediately which is good. I’ll use my password manager to create a strong, random password and save the password in that vault.
Now I’ll connect my TimescaleDB instance by going to Connections > Data Sources > Add Data Source. TimescaleDB isn’t a plugin option in Grafana, but Timescale is simply an extension on PostgreSQL, so I’ll add the Postgres plugin. I’ll name my connection ’timescaleDB’, add my host URL as ‘[NAS IP]:5432’, add my database name, then add my authentication values. I’ll disable TLS/SSL for now because I haven’t set that up yet. For version, I’ll select 15 because it’s the closest to the 18 that I’m running, but this shouldn’t cause an issue due to backwards compatibility. The version is defining the SQL syntax that’s used. I’ll also select the TimescaleDB checkbox because I’m using that extension. I click ‘Save & Test’ and I get a green box that says the config is functioning properly.
Creating Views in Timescale
I’ll hop over to my TimescaleDB instance and make some views so Grafana can query those views. Doing this allows Grafana to not be querying raw data, which in theory should make the data display faster in Grafana and keep any data operations contained within Timescale. I’ll start with some basic ones: most current forecast for my home zone and the most current forecast for my work zone. I’ll open up SQL Shell (or psql) and log in. I’ll then enter the following query to create the home forecast view:
create or replace view current_home_forecast as select starttime as time, temp, precip, windspeed, updated from home_forecast where updated = ( select max(updated) from home_forecast);
Then I’ll make the same but for my work zone:
create or replace view current_work_forecast as select starttime as time, temp, precip, windspeed, updated from work_forecast where updated = ( select max(updated) from work_forecast);
Creating Grafana Panels
I’ll hop back to Grafana and create a new dashboard (Dashboards > New). I’ll select ‘Add Visualization’ and select my timescaleDB data source. I’ll call my panel ‘Current Home Forecast’. For now I’m going to leave most of the options default until I can make sure the visualization works. I can tinker later. I’ll add the following query in the code space:
SELECT time, temp, precip, windspeed from current_home_forecast where $__timeFilter(time) ORDER BY time
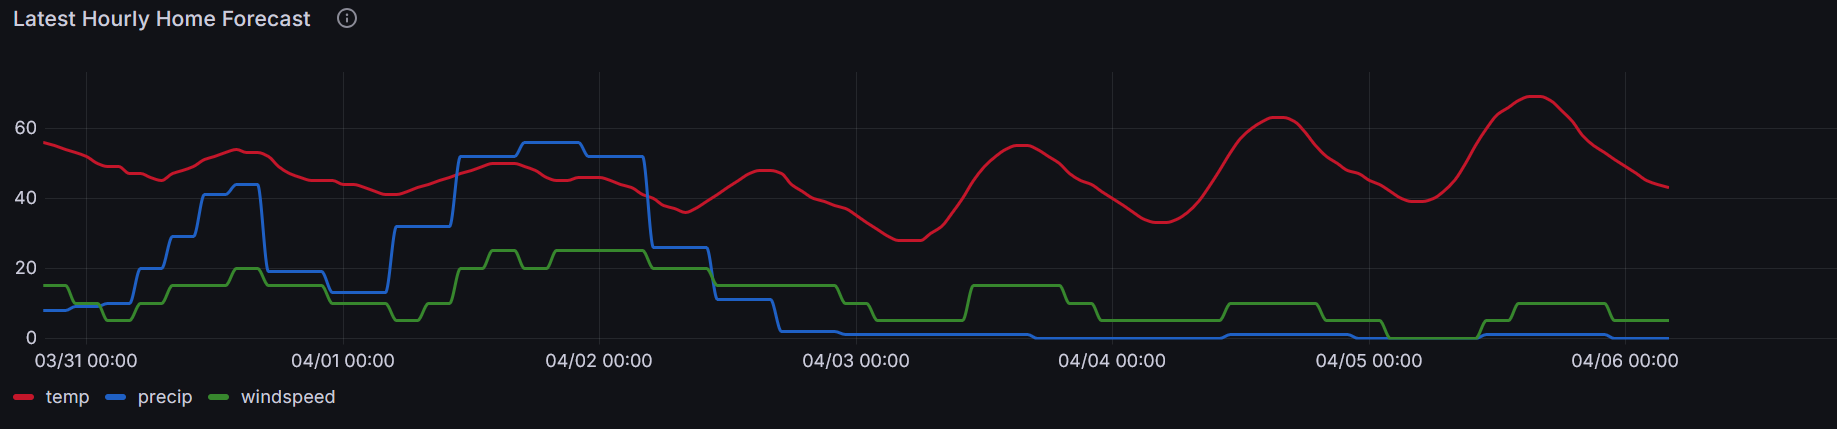
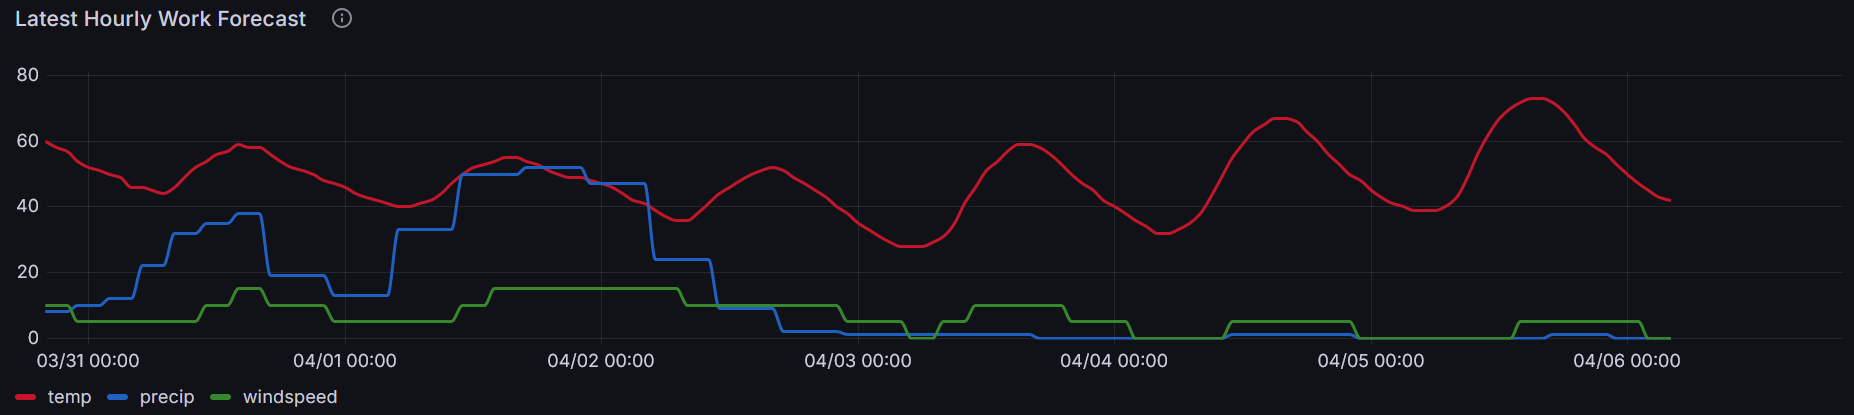
And now I’ve got a graph! I’ll repeat that and create ‘Current Work Forecast’ by altering the query slightly:
SELECT time, temp, precip, windspeed from current_work_forecast where $__timeFilter(time) ORDER BY time
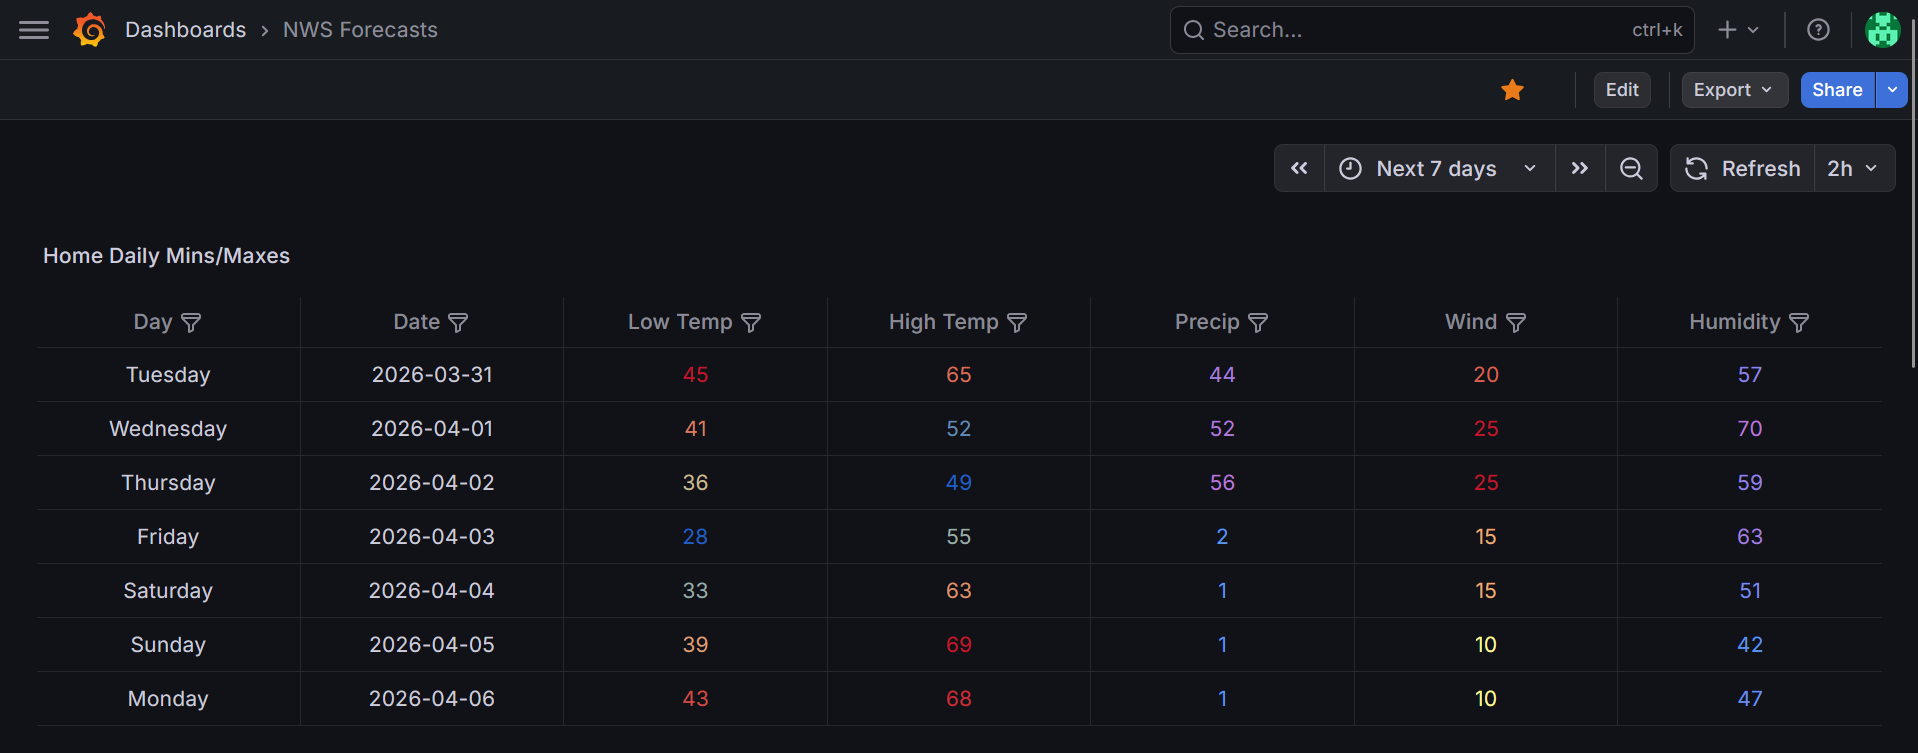
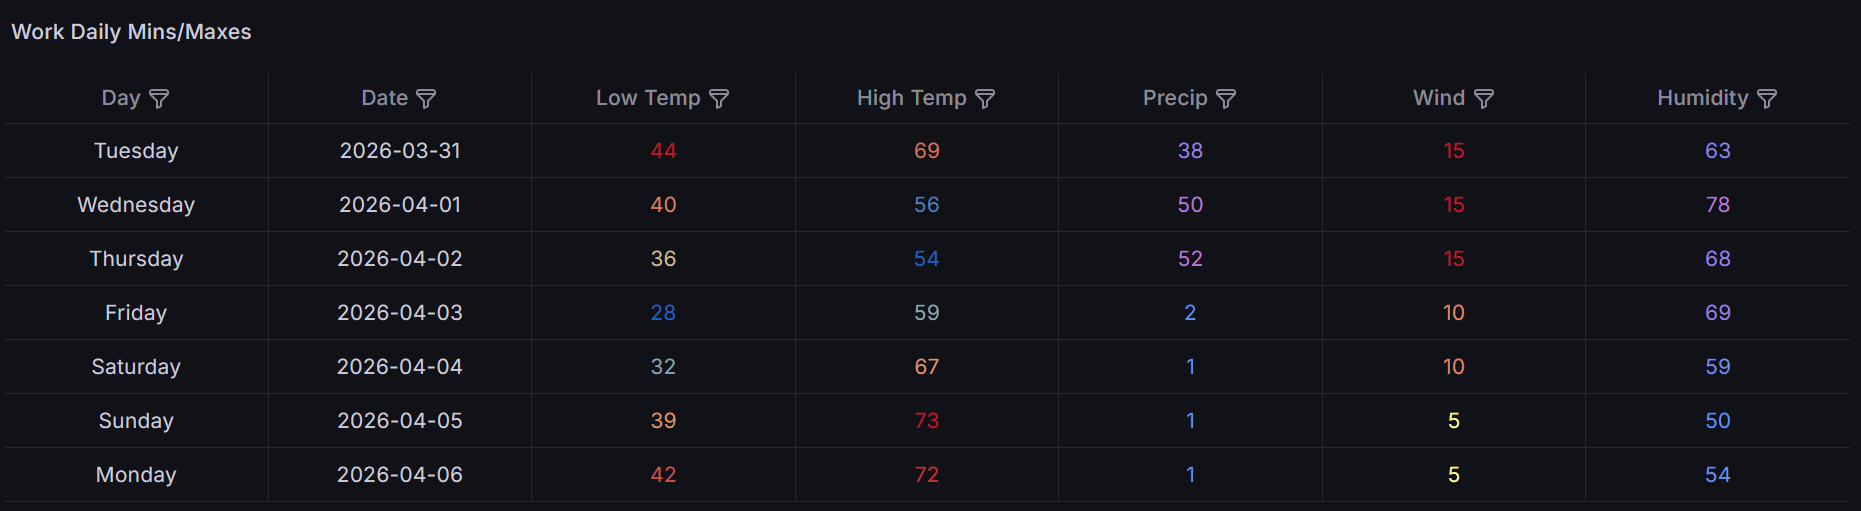
I need to change my default time view for the dashboard to show the next seven days, as that is the time period the forecasts are scraping by entering “now” to “now+7d”. Now I’ve got basic time series graphs showing me hourly forecasts pulled from NWS for both my home and work zones.
Some time later…
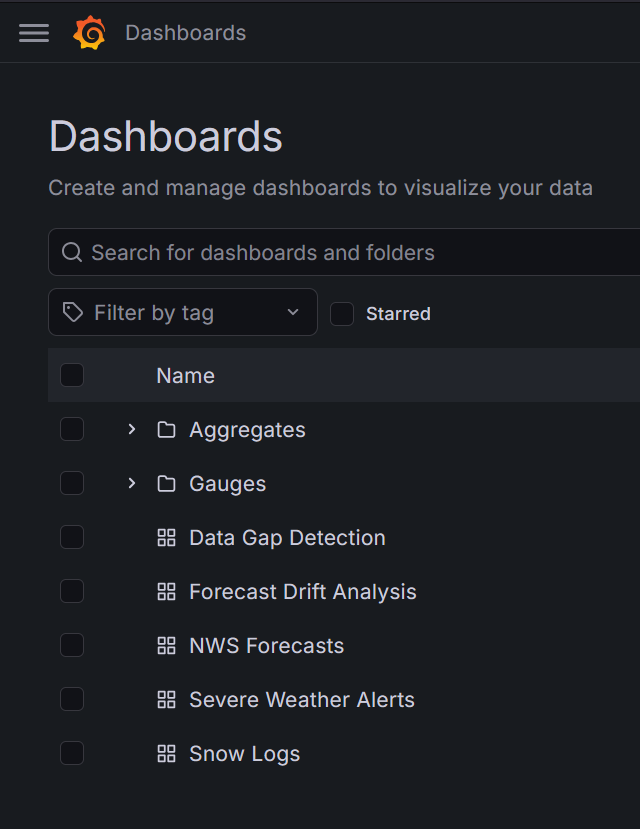
Over time after the initial setup and configuration of Timescale and Grafana I’ve added more views and dashboards. I’ve found digging into the details that I like Grafana a lot, you can make a lot of customizations to the panels, and I really still haven’t dug super deep yet doing things like configuring alerts. Here are some of the things I’ve used Timescale and Grafana to create since the initial setup:
- Live gauges for outdoor and indoor data.
- Hourly, daily, weekly, monthly, and yearly continuous aggregates materialized views for each table which are then connected to time series graphs or tables in Grafana.
- A rain totals dashboard that shows a bar graph of totals for the time periods as well as gauges for the time periods.
- Forecast drift analysis for home and work zones. These ones I find interesting: for the forecast data pulled from NWS, how does the forecast change as the target date approaches?
- A table displaying any current severe weather alerts.
- A table displaying any gaps in data within the last 48 hours. This one still needs to be built out more as it currently only looks at the weather station observations, but this allows me to see gaps in the tables and investigate why there is missing data.
- A table that pulls and displays data from my manual snow events logging API.
I still have more questions to answer using the data I have, so I’ll be doing more data analysis down the road and building more dashboards like comparing the forecast data to the observed data and so on.