I’ve had some outages over time due to planned maintenance or severe weather. What I’m going to work on today is a way to detect missing data in my tables so I can investigate.
TimescaleDB Gap Detection
In my database, I’m going to create some views that will show me gaps in data so I can investigate why those gaps exist if the cause is not planned or apparent.
I’ll start using pgAdmin4 which gives me direct access to my database to create tables and views as well as run queries. I’ll also open my TimescaleDB directory where I store .sql files that contain table schemas or SQL statements and queries in VSCode. I like to create my queries and statements in VSCode, then copy and paste into pgAdmin4.
Now for the gap detection, I really don’t need to monitor all of my tables, I really just need to monitor ws_observations, home_forecast, and work_forecast. Because the weather station pushes one monolith of data and my Python ingest script splits that data into smaller pieces and saves the chunks to the appropriate tables, if ws_observations has a gap, then it follows that console_obs, office_obs, and rain_totals will have gaps as well.
Table Creation
I’ll start with the weather station observations gap detection. I’ll make a new table called “obs_gap_log” with the following statement:
CREATE TABLE obs_gap_log (
	id SERIAL PRIMARY KEY,
	 detected_at TIMESTAMPTZ DEFAULT NOW(),
	 gap_start TIMESTAMPTZ,
	 gap_end TIMESTAMPTZ,
	 gap_duration INTERVAL
);
This will create a table that creates a current timestamp of when a gap is detected, with the start and end times, then a calculation of downtime.
Get The Data & Insert
Now, I’ll create a query that will show me the gaps I have in the ws_observations table:
WITH gaps AS (
    SELECT
        time as gap_end,
        LAG(time) OVER (ORDER BY time) as gap_start,
        time - LAG(time) OVER (ORDER BY time) as gap_duration
    FROM ws_observations
)
SELECT gap_start, gap_end, gap_duration
FROM gaps
WHERE gap_duration > INTERVAL '10 minutes'
ORDER BY gap_start;
I can see entries for gaps that I already know exist. I also have noted with annotations in some of my visualizations in Grafana why those gaps exist, so I’m seeing only verified data, and nothing I wasn’t aware of, so that’s good!
After that, I’ll insert that data into the table that was created:
INSERT INTO obs_gap_log (gap_start, gap_end, gap_duration)
WITH gaps AS (
    SELECT
        time as gap_end,
        LAG(time) OVER (ORDER BY time) as gap_start,
        time - LAG(time) OVER (ORDER BY time) as gap_duration
    FROM ws_observations
)
SELECT gap_start, gap_end, gap_duration
FROM gaps
WHERE gap_duration > INTERVAL '10 minutes'
ORDER BY gap_start;
Automation with bash and cron
Now what I’ll want to do is create a bash script on my Pi that will be called by a cron job that fires every ten minutes to run the insert statement while adding some parameters to prevent duplicate entries:
#!/bin/bash

LOGFILE=/home/prax/scripts/logs/obs_gap_detect.log

echo "--- $(date) ---" >> $LOGFILE

psql -h 10.0.3.2 -U timescaleuser -d weather_db >> $LOGFILE 2>&1 << EOF
INSERT INTO obs_gap_log (gap_start, gap_end, gap_duration)
WITH gaps AS (
    SELECT
        time as gap_end,
        LAG(time) OVER (ORDER BY time) as gap_start,
        time - LAG(time) OVER (ORDER BY time) as gap_duration
    FROM ws_observations
)
SELECT gap_start, gap_end, gap_duration
FROM gaps
WHERE gap_duration > INTERVAL '10 minutes'
AND gap_start > (SELECT COALESCE(MAX(gap_end), '1970-01-01') FROM obs_gap_log)
ORDER BY gap_start;
EOF

echo "Finished: $(date)" >> $LOGFILE

echo "" >> $LOGFILE
I’ll transfer that script to my Pi with SCP, run dos2unix on it, chmod +x the script, then make the cron job to fire every 10 minutes:
*/10 * * * * /home/prax/scripts/obs_gap_detect.sh
I wind up with a table that looks like this:
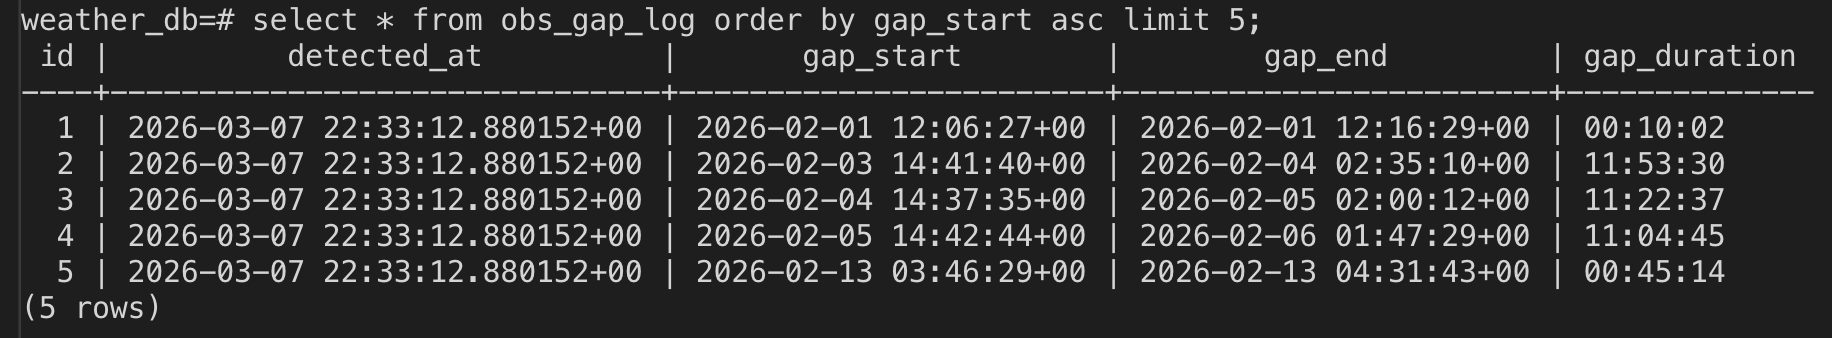
I’ll also add the log file location to my logrotate file so I can manage the log file size automatically.
Visualization with Grafana
Now I can pop into Grafana and make a panel to view the output of the table. I’ll make a new dashboard called “Data Gap Detection”, then create a panel with a table that queries the obs_gap_log table. I’ll start with querying all entries just so I know that the panel is functioning, then I’ll narrow the results to show only the last 48 hours.
On the initial creation, I grabbed all columns, which included the ID. I don’t think I need that column for the dashboard display purposes, so I’ll refine the query now to the following which will use some aliasing to make the table headers look nice and limit the data shown:
SELECT
	detected_at AS "Detected At",
	gap_start AS "Start",
	gap_end AS "End",
	gap_duration AS "Duration"
FROM obs_gap_log
WHERE detected_at >= NOW() - INTERVAL '48 hours'
ORDER BY detected_at DESC;
I can now monitor for any potential issues in my ingest pipeline and be alerted to investigate logs for any errors.
One issue with this setup is that the entries will only appear in the respective tables once an outage is finished and everything is functioning again. So, this really isn’t ideal for live outage detection, it’s more of a historical record.
NWS Forecast Errors
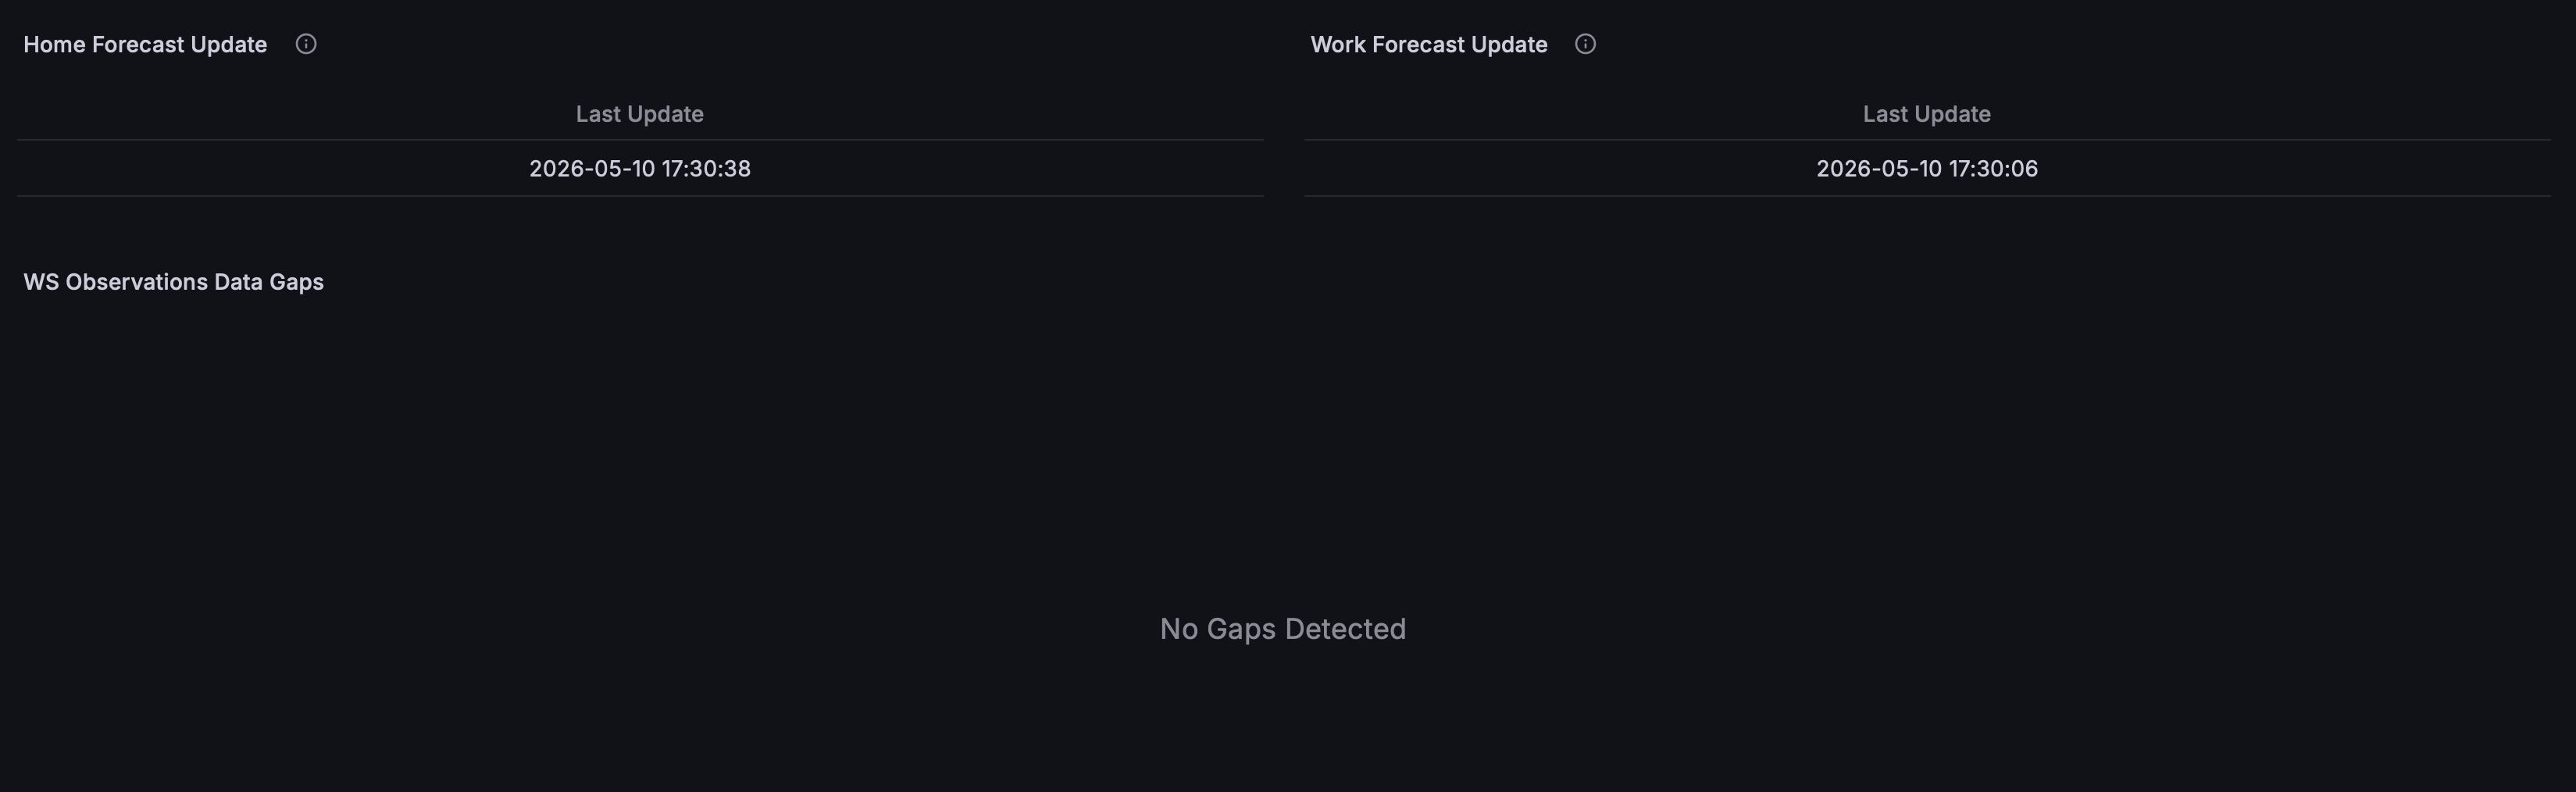
This is a lot more simple than all of the above. In Grafana, I simply made panels on my Gap Detection dashboard that query the last updated time for both the home and work forecasts. If those times are not what is expected, then I know a failure occurred and to check my logs to see what happened.
The whole dashboard winds up looking like this:
Going Forward
I’ll also create a watchdog script that checks that the date and time of the most recent entries in the database are within the last 10 minutes, and if the data is stale, restart the Ecowitt ingest service. This will allow me to detect gaps live instead of waiting until whatever issue was resolved. It will also give a bit of resilience and potential to self correct quickly without needing me to intervene. I plan on using a private Matrix server and Tailscale to send alerts for my wildfire alert system, so I might use that existing infrastructure to have another bot to send gap detection alerts as well.