What Is VPD?
VPD stands for Vapor Pressure Deficit and is affected by temperature and humidity. This calculation shows the difference between how much moisture is in the air versus what it can hold when saturated. When VPD is in an ideal range, this allows plants to basically act like a straw pulling water up from the soil, taking in carbon dioxide, and releasing oxygen and moisture into the air.
VPD has a goldilocks zone based on plant type and stage of growth, so the ideal window will vary, but neither too low nor too high are good. When VPD is too low, the plant can’t transpire effectively and can lead to stagnant growth or potential issues with mold. When VPD is too high, it causes excessive water loss in the plants and causes stomatal closure.
There’s obviously not much to be done to create ideal VPD, but we can make sure we do some things to take advantage of ideal VPD like irrigating before the window so that water is in the soil ready to be absorbed by the plant.
Daily Analysis
The first thing I want to look at when it comes to VPD is just simply daily stats. I’m going to create a materialized view in my Timescale instance to show me min, max, average VPD and time spent in the ideal VPD window for each day since I’ve been logging the data. For now, I’ve defined my ideal VPD window as 0.4 kilopascal to 1.2kPa. Like I said, this will vary based on plant type and growth stage.
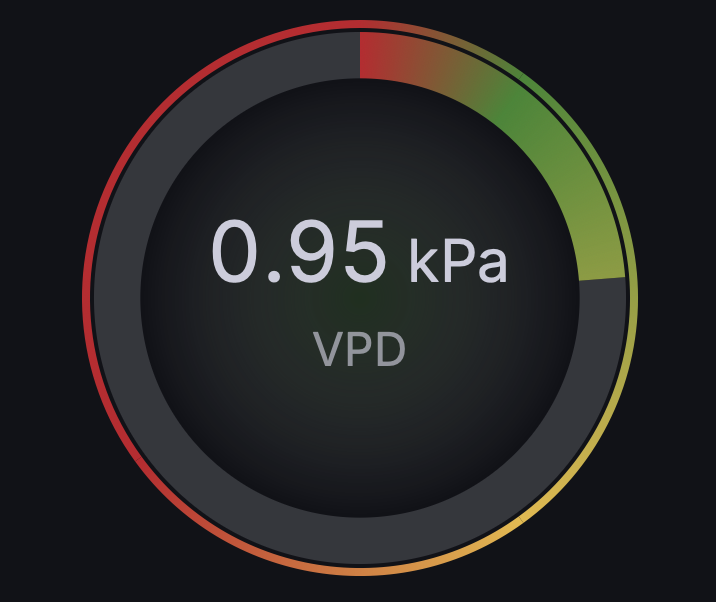
Here’s the gauge I’ve made for live monitoring of the raw data that is pushed every five minutes from the weather station:
Here’s the statement I used to create my view:
CREATE MATERIALIZED VIEW vpd_daily_stats
WITH (timescaledb.continuous) AS
SELECT
time_bucket('1 day', time) AS day,
-- Hours in ideal range (each 5-min interval = 1/12 hour)
COUNT(*) FILTER (WHERE vpd >= 0.4 AND vpd <= 1.2) / 12.0 AS hours_in_range,
-- Total observations for coverage check
COUNT(*) AS total_obs,
-- Min/max for context
MIN(vpd) AS vpd_min,
MAX(vpd) AS vpd_max,
AVG(vpd) AS vpd_avg
FROM ws_observations
WHERE vpd IS NOT NULL
GROUP BY time_bucket('1 day', time)
WITH NO DATA;
I’m going to create the table with no data because I was not initially saving the VPD data. My weather station console calculates the VPD data on board, then pushes it with the rest of the data. Initially, I didn’t know what VPD was and how important it was, so I wasn’t saving the data from 02/01/2026 until 04/10/2026. April 10th, I installed my lightning strike detector. While looking at the raw data being pushed to determine the fields to save for the lightning data, I saw VPD again, decided to look it up, then added it to my ws_observations table when I realized how important it was.
Because I have null values for the VPD column up until 04/10, I’ll run this query to fill the appropriate amount of data to the new materialized view:
CALL refresh_continuous_aggregate('vpd_daily_stats', '2026-04-10', NULL);
Then I’ll set my refresh policy:
SELECT add_continuous_aggregate_policy('vpd_daily_stats',
start_offset => INTERVAL '3 days',
end_offset => INTERVAL '1 hour',
schedule_interval => INTERVAL '1 hour');
Gaps and Islands
Another thing that I want to see is how VPD is changing throughout the day. Are there days where VPD drops in and out of the ideal zone throughout the day? How long does VPD stay in the ideal range? Longer windows within the ideal range are better than dipping in and out all day as the plant is more productive with a sustained window. So I’ll make the view with the following statement:
CREATE VIEW vpd_daily_longest_window AS
WITH flagged AS (
SELECT
time,
DATE_TRUNC('day', time) AS day,
CASE WHEN vpd >= 0.4 AND vpd <= 1.2 THEN 1 ELSE 0 END AS in_range
FROM ws_observations
WHERE vpd IS NOT NULL
),
islands AS (
SELECT
day,
in_range,
time,
ROW_NUMBER() OVER (PARTITION BY day ORDER BY time) -
ROW_NUMBER() OVER (PARTITION BY day, in_range ORDER BY time) AS grp
FROM flagged
),
island_lengths AS (
SELECT
day,
in_range,
grp,
COUNT(*) / 12.0 AS window_hours
FROM islands
GROUP BY day, in_range, grp
)
SELECT
day,
COALESCE(MAX(window_hours) FILTER (WHERE in_range = 1), 0) AS longest_window_hours
FROM island_lengths
GROUP BY day;
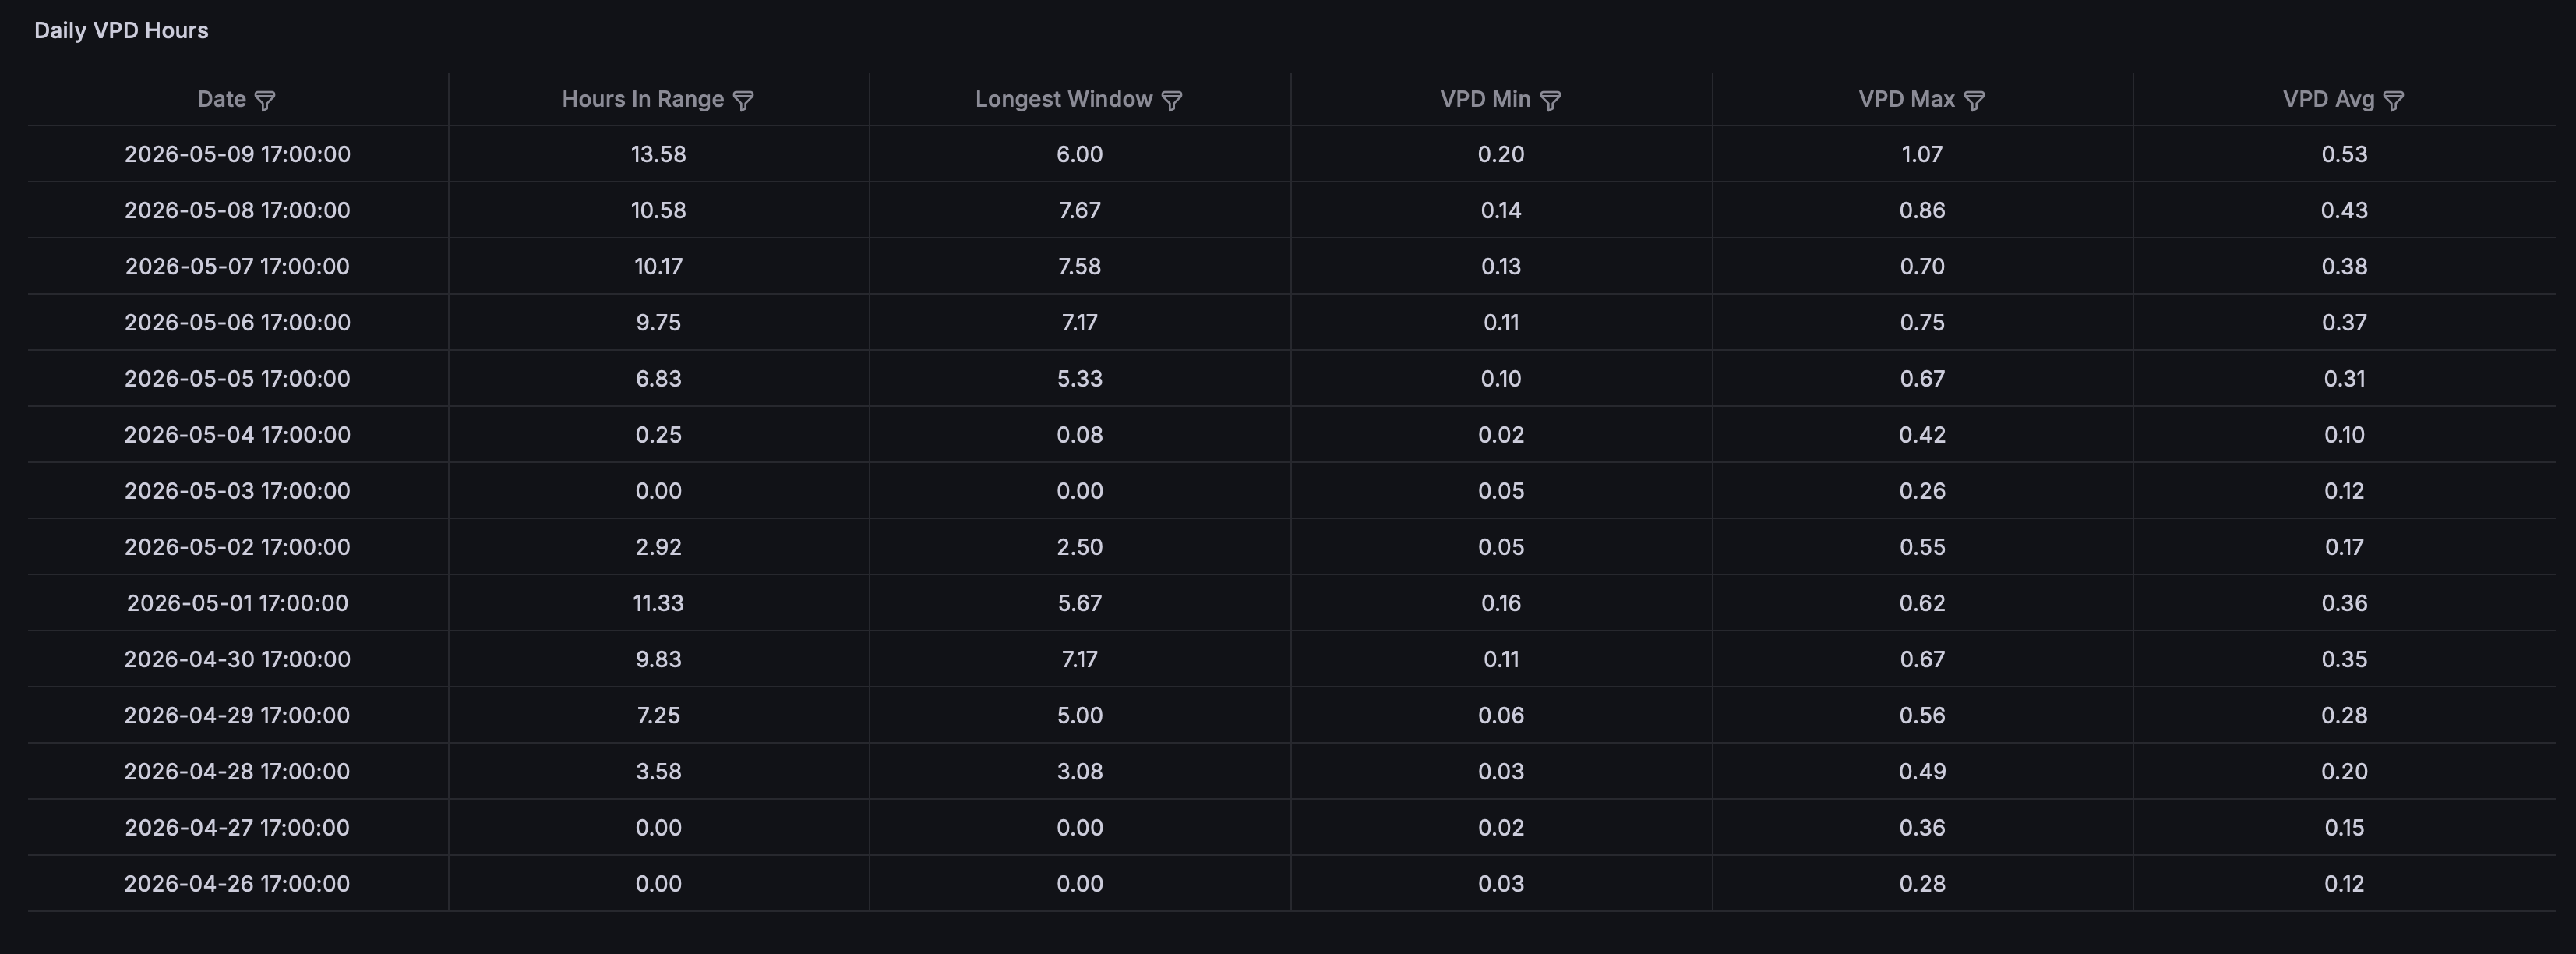
Now, what I’ll do is use the following statement to compare the two views, which is what I’ll use in Grafana to make my dashboard to show me the last two weeks of data:
SELECT
s.day::date AS "Date",
ROUND(s.hours_in_range::numeric, 2) AS "Hours In Range",
ROUND(w.longest_window_hours::numeric, 2) AS "Longest Window",
ROUND(s.vpd_min::numeric, 2) AS "VPD Min",
ROUND(s.vpd_max::numeric, 2) AS "VPD Max",
ROUND(s.vpd_avg::numeric, 2) AS "VPD Avg"
FROM vpd_daily_stats s
JOIN vpd_daily_longest_window w ON w.day = s.day
ORDER BY s.day DESC LIMIT 14;
And I wind up getting something that looks like this:
Monthly Tallies
The final view I’m going to make is going to tally the number of days which hit that ideal VPD window per month. This will show me trends of how the weather is shifting. Winter for example should show low to zero days with ideal VPD hits, spring and fall will likely have the highest counts. Here’s the statement I’ll run:
CREATE VIEW vpd_monthly_stats AS
SELECT
DATE_TRUNC('month', day) AS month,
COUNT(*) FILTER (WHERE hours_in_range > 0) AS days_hitting_range,
COUNT(*) AS total_days,
ROUND(AVG(hours_in_range)::numeric, 2) AS avg_hours_in_range,
ROUND(MAX(hours_in_range)::numeric, 2) AS best_day_hours
FROM vpd_daily_stats
GROUP BY DATE_TRUNC('month', day)
ORDER BY month;
Then in Grafana, I need to account for the timestamps being stored in UTC in the database, but being displayed in local time. This causes the dates to shift and show the last day of the prior month without correction:
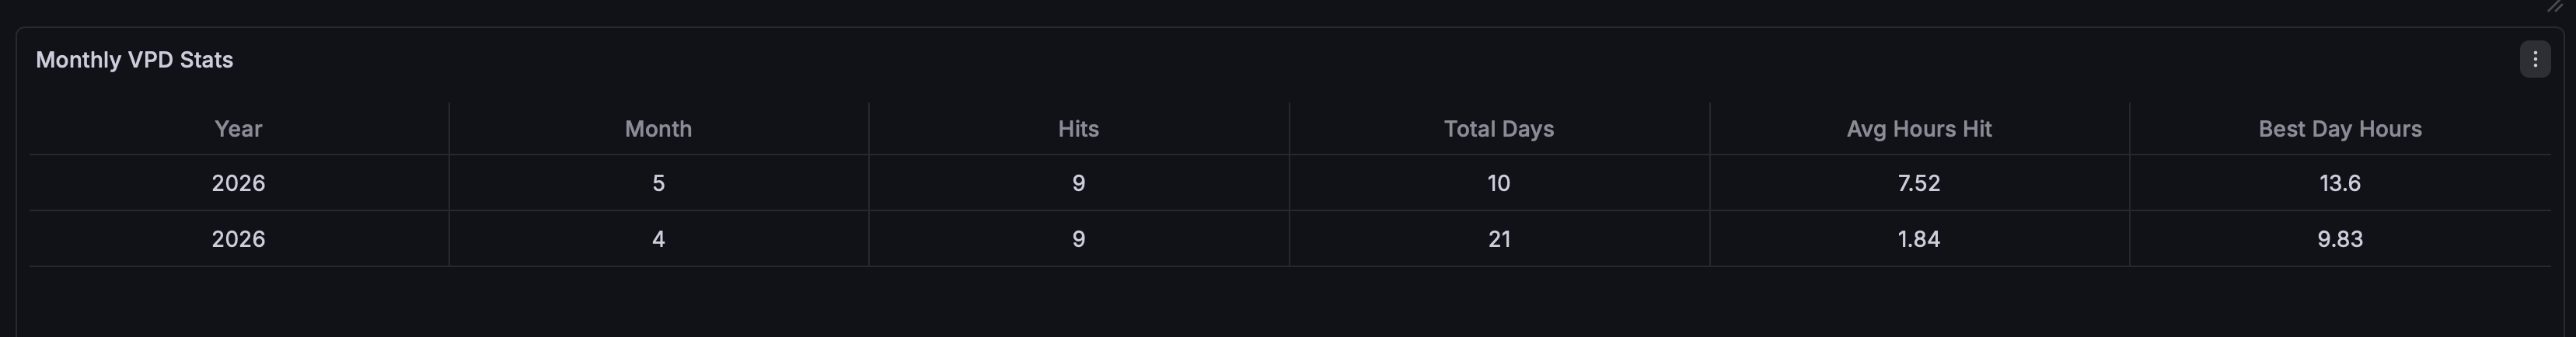
SELECT
EXTRACT(year FROM month)::int AS "Year",
EXTRACT(month FROM month)::int AS "Month",
days_hitting_range AS "Hits",
total_days AS "Total Days",
avg_hours_in_range AS "Avg Hours Hit",
best_day_hours AS "Best Day Hours"
FROM vpd_monthly_stats
ORDER BY month DESC LIMIT 12;
And that gives me a table that looks like this:
Going Forward
For now, the name of the game is to just keep collecting the data. I’ve got my dashboards and views so I can keep an eye on trends.
The real value of doing this analysis though will be when I have more data collected and start applying machine learning. This will allow me to connect this data to the general conditions surrounding these events to be able to predict when the VPD will fall into the ideal range. That will allow me to run irrigation at appropriate times to load the soil with water before ideal VPD occurs.
The VPD fragmentation will also be a good thing to monitor as there could be multiple reasons depending on conditions so the max VPD gives clues as to why there could be fragmentation. Anyway, that’s a story for another day.