Having a lot of data collected can be a good thing, but it’s important to be able to pull the signal from the noise to be able to act upon the data. What’s the point in collecting all of this data if I’m not going to use it? I’m going to create some materialized views in Timescale that I can query with Grafana that will show me useful data that I can act on.
Observation Aggregates
I initially started with pulling raw weather station readings from my five minute intervals into Grafana and displaying them with time series graphs. This was useful, but I decided that I wanted to create some aggregates so I wasn’t pulling so much raw data and my Grafana dashboards would be quick and snappy.
I decided to make multiple continuous aggregate materialized views for each table in my database. I created views for hourly, daily, weekly, monthly, and yearly periods, then created Grafana dashboards for them. Here’s the query I used to create the daily view, the pattern is the same for all other periods, with the difference being changing the bucket size:
CREATE MATERIALIZED VIEW weather_hourly_aggs
WITH (timescaledb.continuous) AS
SELECT
    time_bucket('1 hour', time) AS period_start,
    MIN(tempf) as temp_min,
    MAX(tempf) as temp_max,
    AVG(tempf) as temp_avg,

    AVG(humidity) as humidity_avg,

    AVG(baromabsin) as pressure_avg,

    AVG(windspeedmph) as windspeed_avg,
    MAX(windspeedmph) as windspeed_max,
    MAX(windgustmph) as windgust_max,

    AVG(solarradiation) as solar_avg,
    MAX(solarradiation) as solar_max,

    AVG(uv) as uv_avg,
    MAX(uv) as uv_max,

    AVG(eventrainin) as rain_rate_avg,
    MAX(eventrainin) as rain_rate_max,
    MAX(eventrainin) - MIN(eventrainin) as rain_total_hour,

    COUNT(*) as observations_count

FROM ws_observations
GROUP BY period_start;
Once the view is created, I also created policies to automatically update the views. Again, same pattern, just changing time buckets to match the view bucket:
SELECT add_continuous_aggregate_policy(
    'weather_hourly_aggs',
    start_offset => INTERVAL '3 hours',
    end_offset => INTERVAL '0 minutes',
    schedule_interval => INTERVAL '5 minutes'
);
And I wind up with some dashboards that look like these:
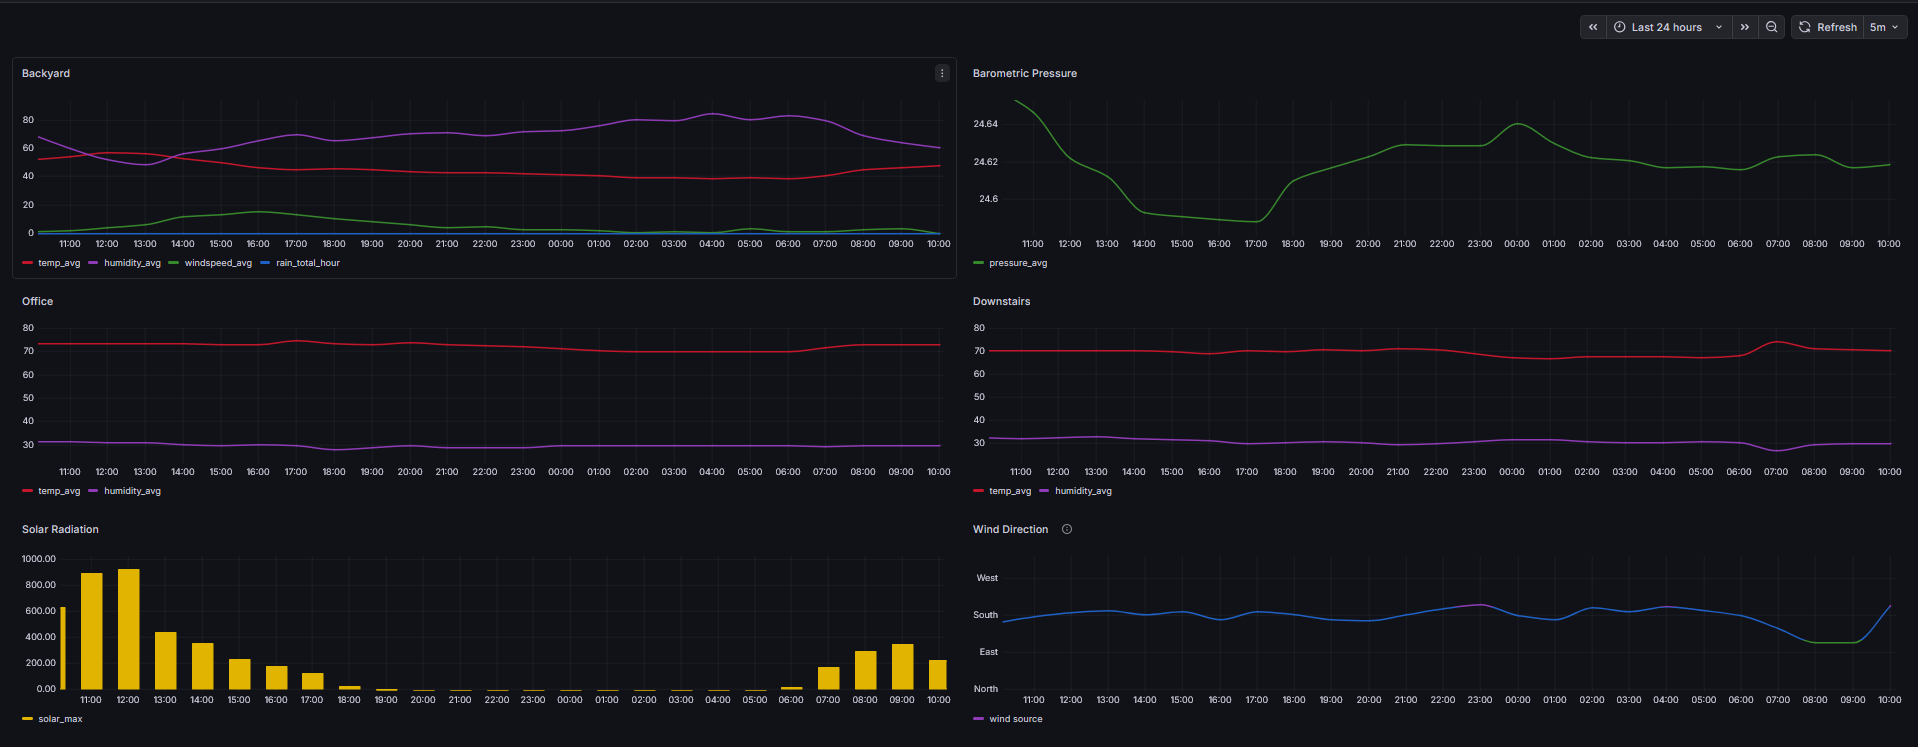
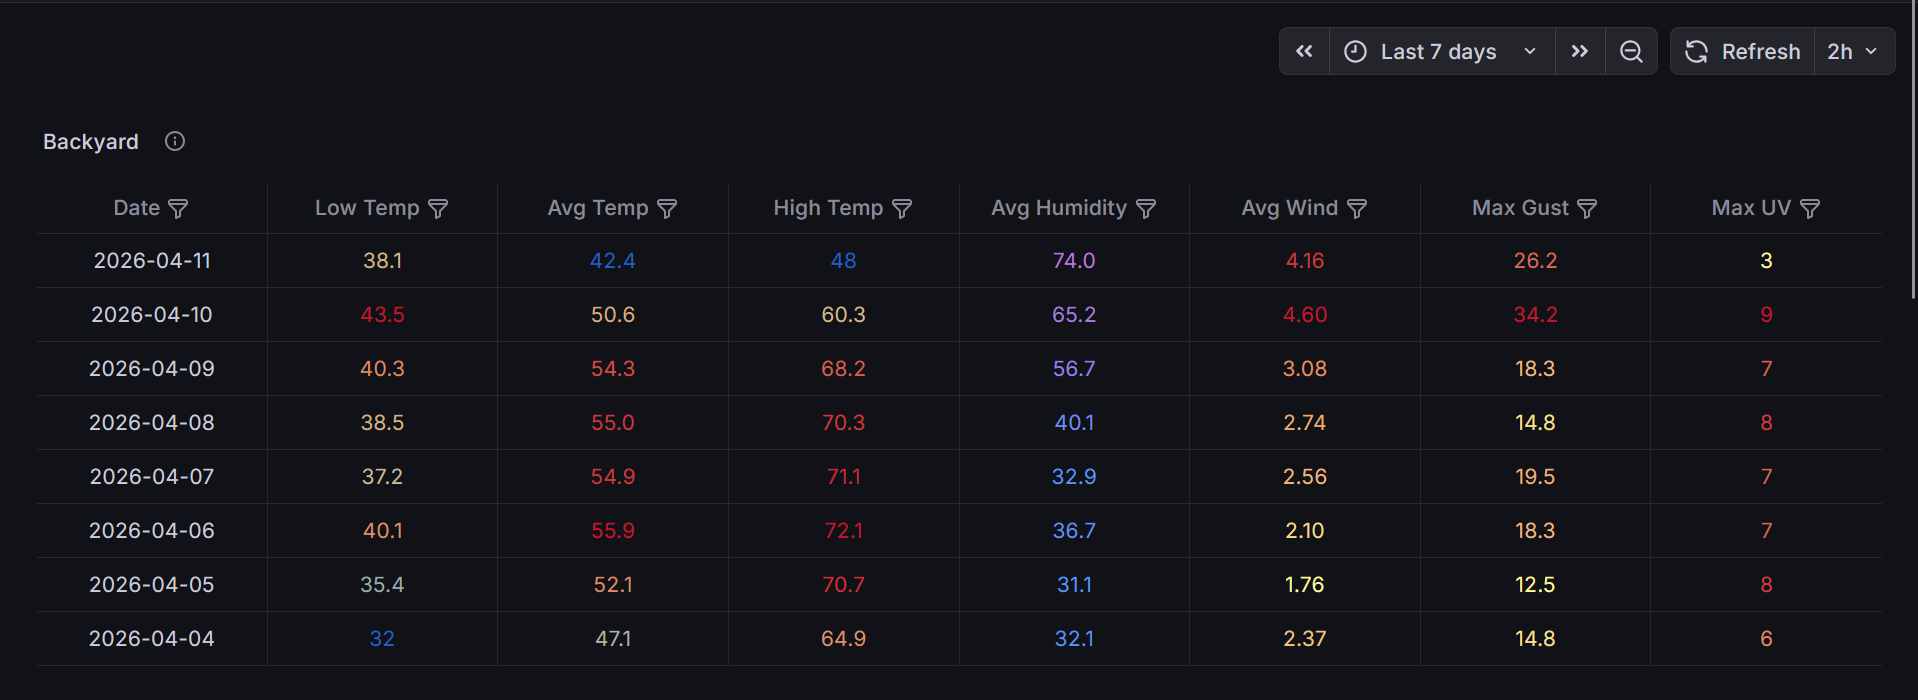
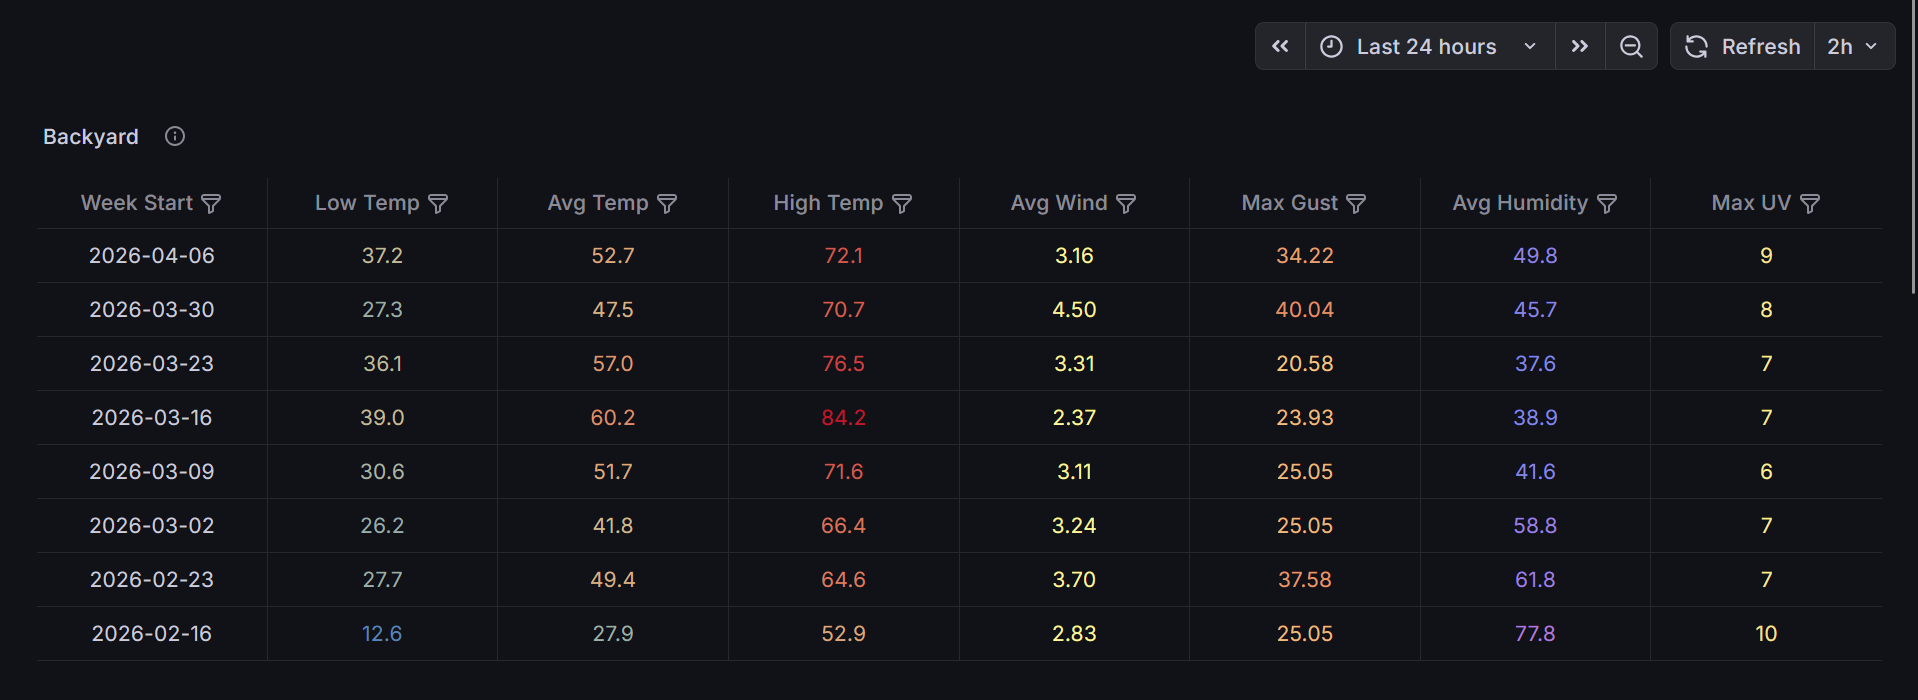
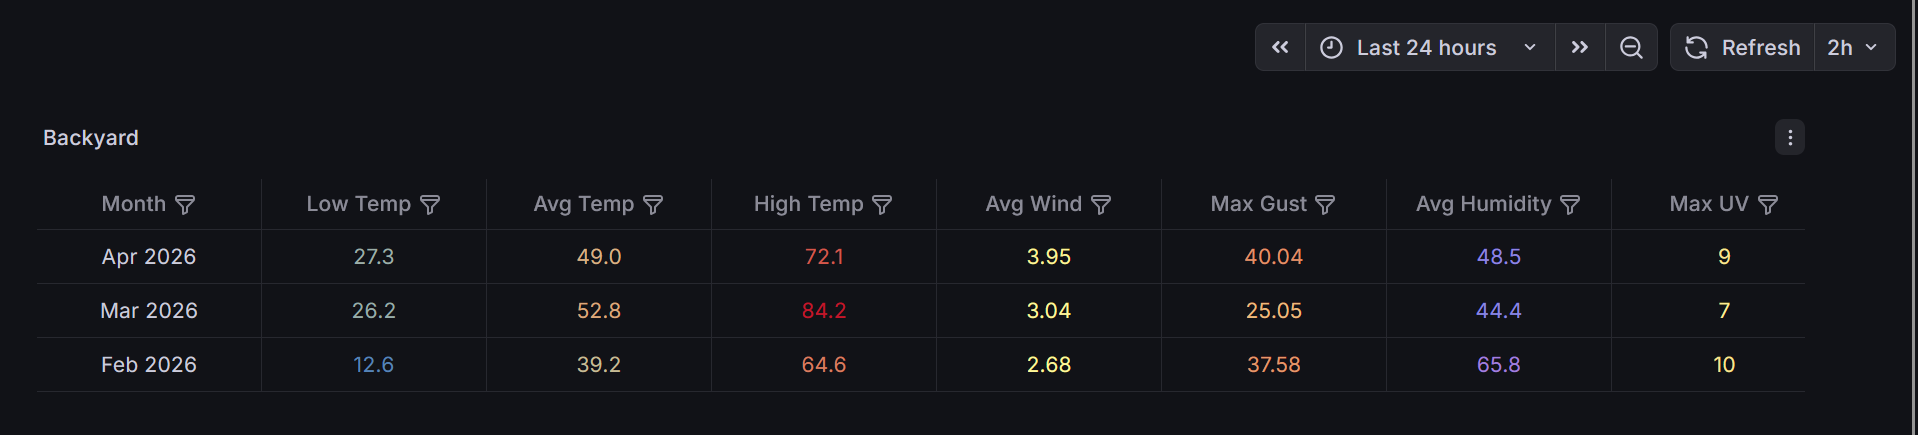
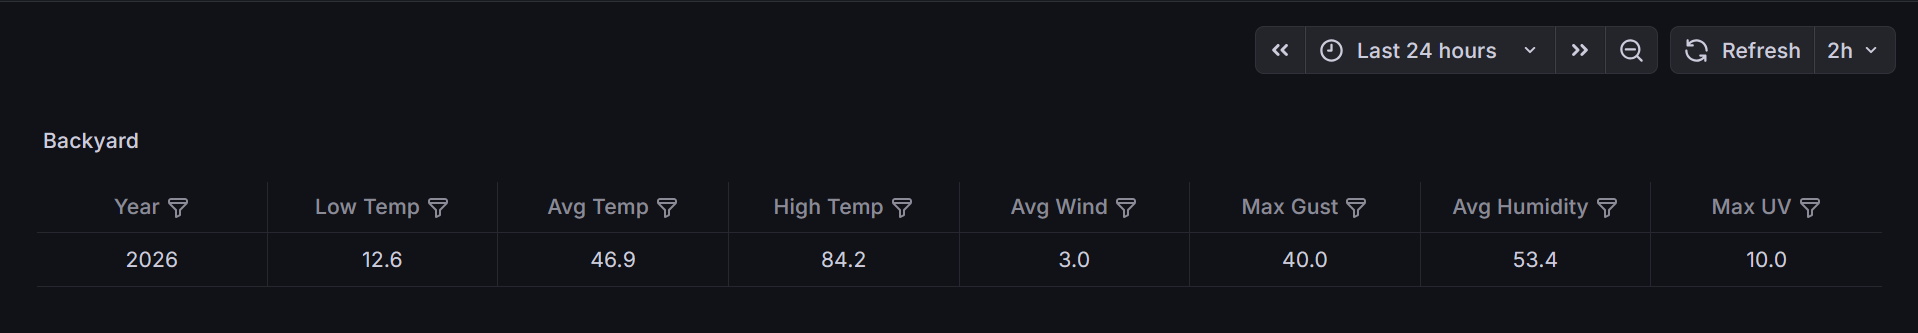
So now I can see my historical observations for my back yard sensors, the console downstairs, and the sensor in my office that hangs on the side of my server rack!
Forecast Drift Analysis
I’ve also already created some basic analysis for the forecast data where I’m looking at how much the forecast changes as the target period approaches. I’ve called this my forecast drift analysis, and I’ve got a continuous aggregate materialized view in TimescaleDB that calculates the data, then I hooked that into Grafana to give me a table showing the absolute value deltas comparing T-x hours to T-0. This helps me see how much the forecast for a given date might change based on how many hours out the target period is.
Here’s how I created the view:
CREATE MATERIALIZED VIEW home_forecast_drift AS
WITH drift AS(
    SELECT
        starttime,
        updated,
        ROUND(EXTRACT(EPOCH FROM (starttime - updated)) / 3600) AS hours_out,
        ABS(temp - LAST_VALUE(temp) OVER (
            PARTITION BY starttime ORDER BY updated
            ROWS BETWEEN UNBOUNDED PRECEDING AND UNBOUNDED FOLLOWING
        )) as temp_drift,
        ABS(windspeed - LAST_VALUE(windspeed) OVER (
            PARTITION BY starttime ORDER BY updated
            ROWS BETWEEN UNBOUNDED PRECEDING AND UNBOUNDED FOLLOWING
        )) as wind_drift,
        ABS(precip - LAST_VALUE(precip) OVER (
            PARTITION BY starttime ORDER BY updated
            ROWS BETWEEN UNBOUNDED PRECEDING AND UNBOUNDED FOLLOWING
        )) as precip_drift
    FROM home_forecast
    WHERE starttime > updated
)
SELECT
    hours_out AS "Hours Out",
    ROUND(AVG(temp_drift)::numeric, 2) AS "Avg Temp Drift",
    ROUND(AVG(wind_drift)::numeric, 2) AS "Avg Wind Drift",
    ROUND(AVG(precip_drift)::numeric, 2) AS "Avg Precip Drift",
    COUNT(*) AS "Sample Count"
FROM drift
GROUP BY "Hours Out"
ORDER BY "Hours Out" DESC;
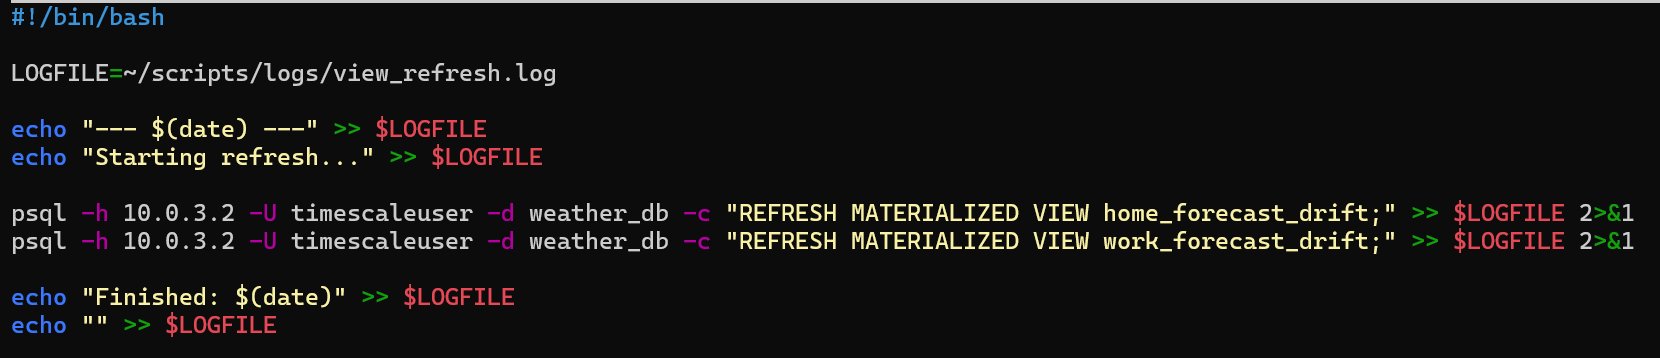
Now, the issue with my Timescale container is that it doesn’t have pg_cron, so I can’t set a cron job within the container to update this view. No problem though, I created a bash script on my Pi to send the refresh command and set that up as a cron job which fires five minutes after my NWS scrapers run.
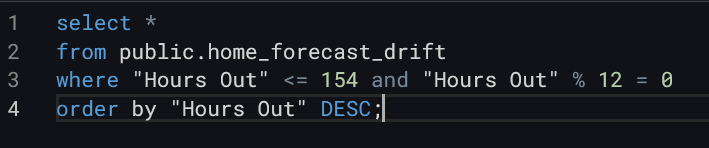
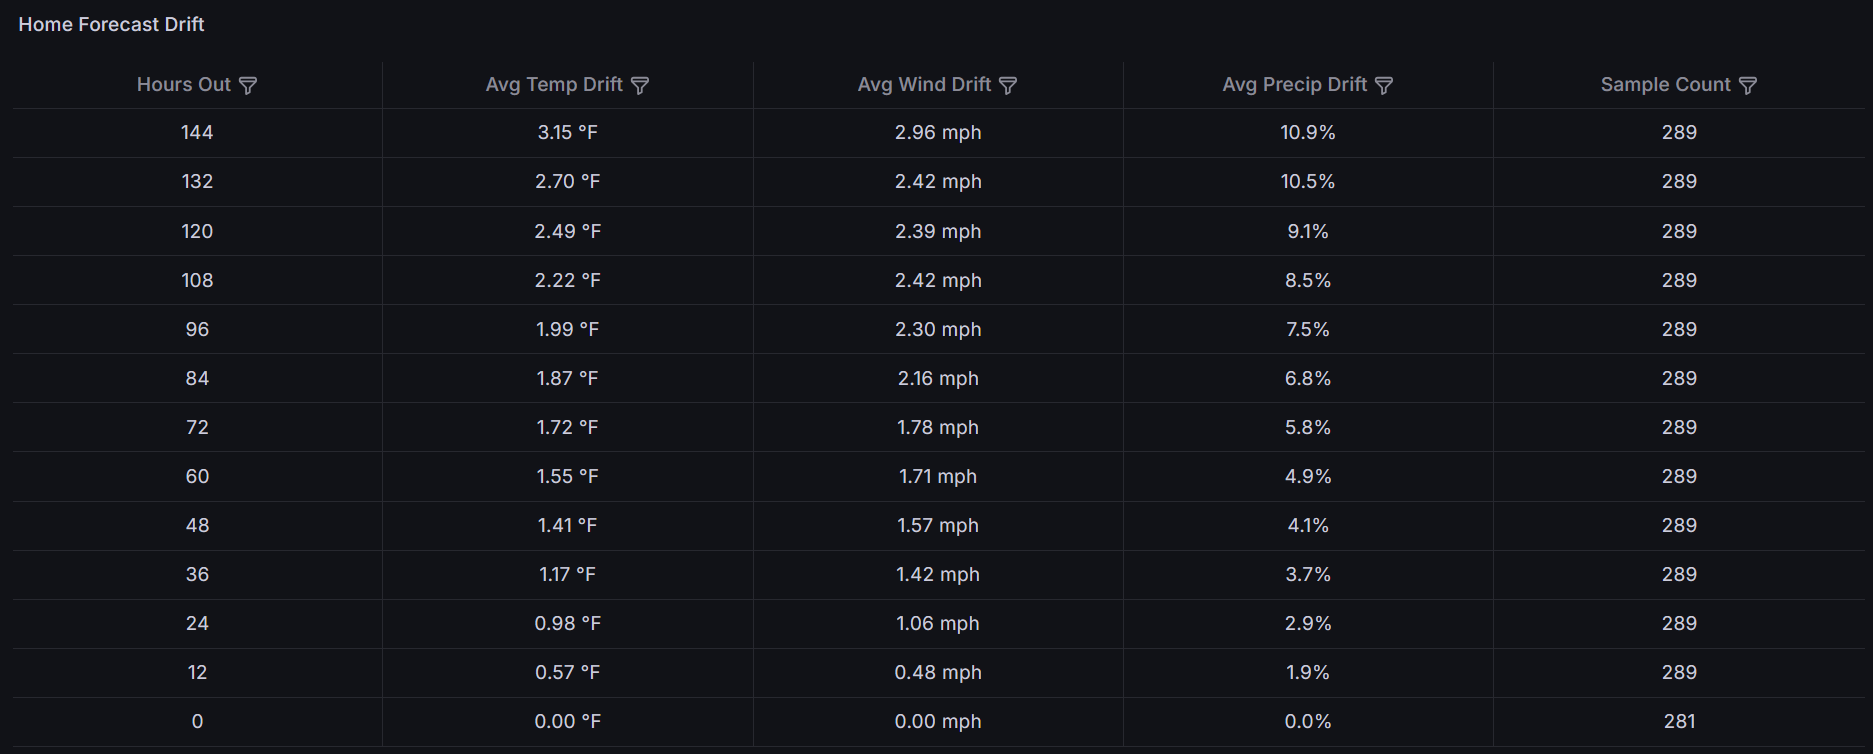
And here’s the final result in Grafana. While the view calculates the absolute value delta for all hourly periods, I only grabbed 12 hour periods to display in Grafana so the table would be cleaner.
Forecast Accuracy
Fast forward to today, and I’m going to set up some views to answer a few more questions:
- How accurate is the NWS forecast compared to my local microclimate?
- There are some geographical differences between the NWS station location and my location. I’m about 200 feet up on a hill on the side of the valley, their station appears to be down in the valley itself.
- How often do I record rain events when the forecast shows a non-zero precipitation chance?
- This will be useful down the road when I apply ML to my irrigation system to make decisions about whether to run irrigation or not when there is a chance of precipitation in the forecast.
Data Formats
The forecast data I’m pulling from NWS gives me hourly predictions for a 156 hour window. Each scrape gives me a new set of multiple data points for each of the 156 periods, so I wind up having multiple entries for a given date and hour. So to compare how accurate the forecast is to my observed conditions, I’ll pull the last forecast for the given period to compare to the hourly observations aggregate.
Temp, Wind, and Humidity
I’ll create a view that compares the forecast table values to the continuous aggregates view based on the period start time.
CREATE MATERIALIZED VIEW forecast_accuracy AS
SELECT
    fc.starttime,
    EXTRACT(MONTH FROM fc.starttime) AS month,

    fc.temp AS forecast_temp,
    obs.temp_avg AS observed_temp,
    obs.temp_avg - fc.temp AS temp_delta,

    fc.windspeed AS forecast_wind,
    obs.windspeed_avg AS observed_wind,
    obs.windspeed_avg - fc.windspeed AS wind_delta,

    fc.humidity AS forecast_humidity,
    obs.humidity_avg AS observed_humidity,
    obs.humidity_avg - fc.humidity AS humidity_delta
FROM (
    SELECT DISTINCT ON (starttime) *
    FROM home_forecast
    ORDER BY starttime, updated DESC
) fc
JOIN weather_hourly_aggs obs ON obs.period_start = fc.starttime
WHERE obs.period_start < NOW();
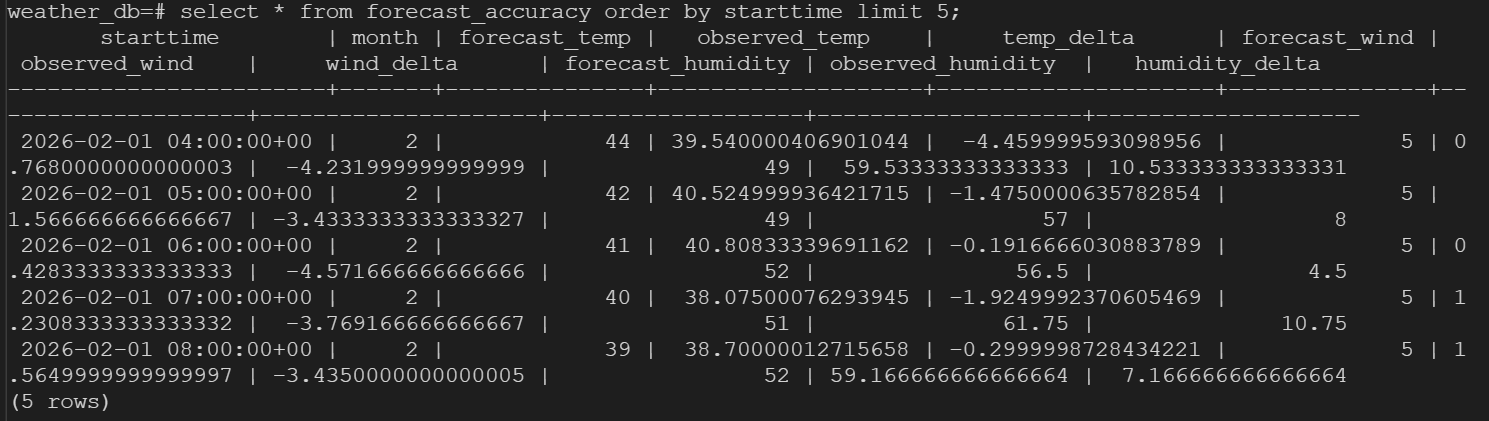
Once I have my view, I can see it’s giving me the data where the observed data is reporting as higher or lower compared to the forecast data, which is the view of things I want.
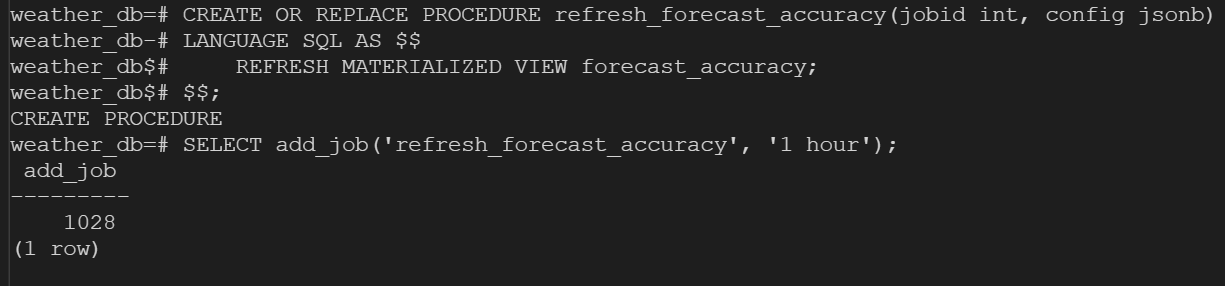
Now I’ll create a procedure and schedule it to run hourly to update the view.
Now that I can see the deltas for individual days, I’m going to give myself a summary view that averages the deltas and divvies them up by month.
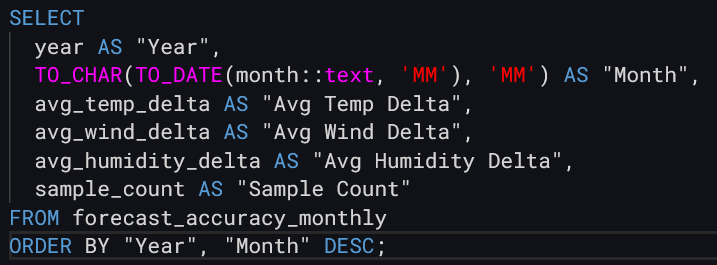
CREATE VIEW forecast_accuracy_monthly AS
SELECT
    EXTRACT(YEAR FROM starttime) as year,
    month,
    ROUND(AVG(temp_delta)::numeric, 2) AS avg_temp_delta,
    ROUND(AVG(wind_delta)::numeric, 2) AS avg_wind_delta,
    ROUND(AVG(humidity_delta)::numeric, 2) AS avg_humidity_delta,
    COUNT(*) AS sample_count
FROM forecast_accuracy
GROUP BY year, month
ORDER BY year, month;
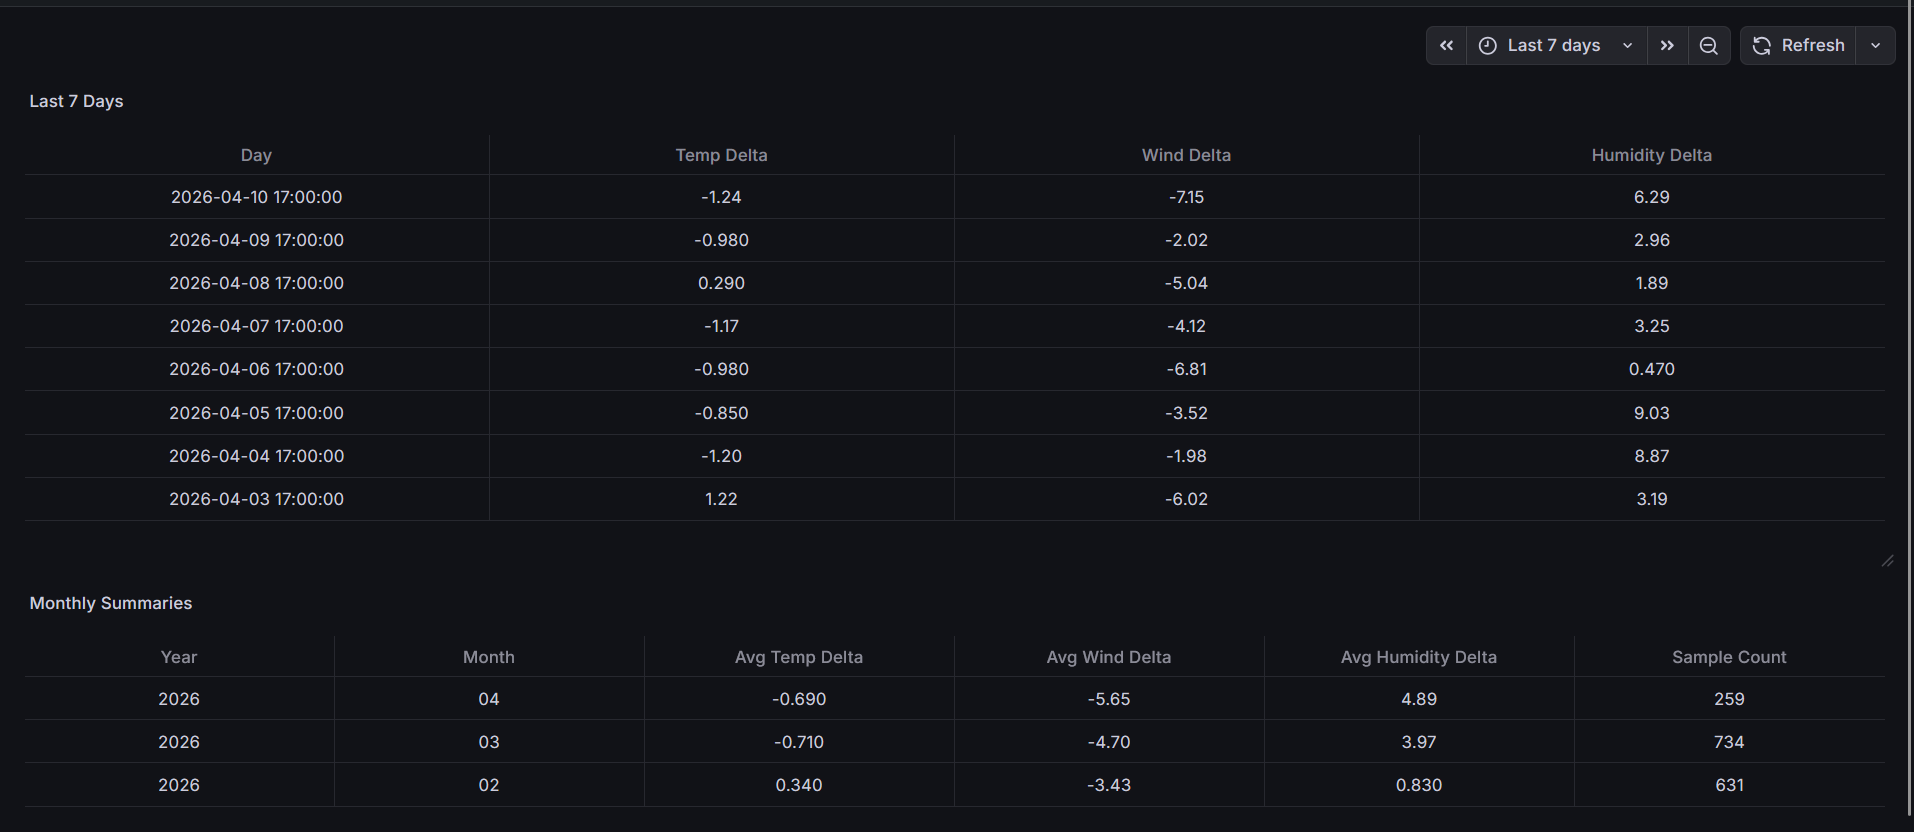
That gives me a view that looks like this:
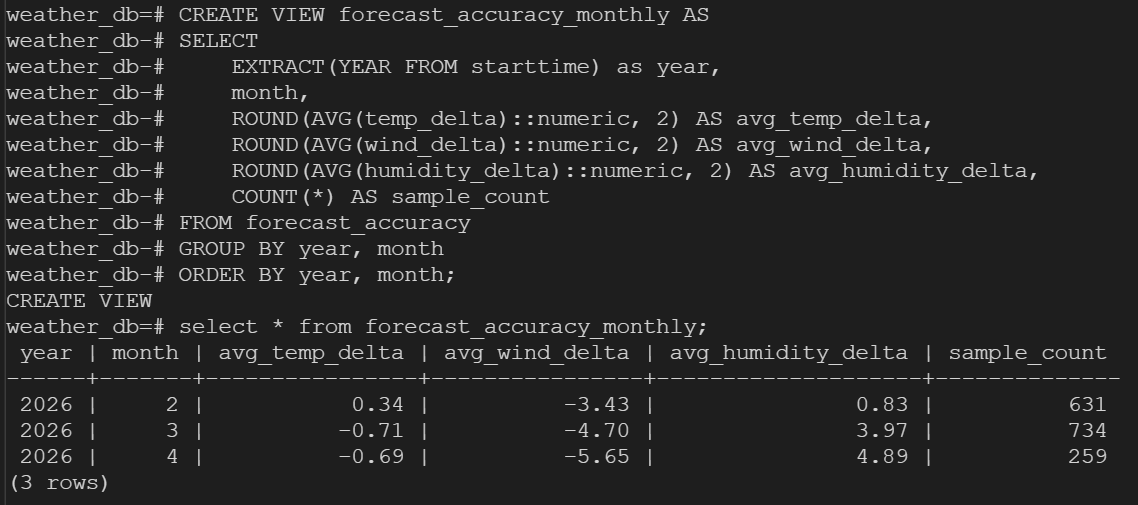
This data is interesting because I currently have my weather station mounted in a temporary location that is a bit sheltered by the house. I plan on moving the station when the weather is more suitable for digging to a 4"x6"x10’ post sunk 2’ and cemented into a location more centered in the open area of the back yard which will give me different, more accurate readings. Because this is a regular view, I don’t need to create a procedure or refresh job, it will recalculate every time it’s queried.
So now I’ll pop over to Grafana and make a dashboard to visualize the data.
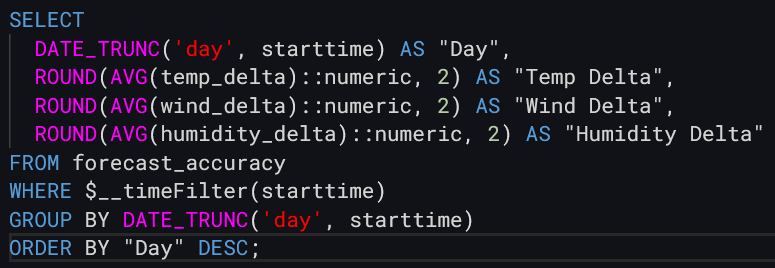
And here’s the quick and dirty dashboard that I’ll polish later:
Precipitation
The last thing I want to do for today is to see how often I record rain events on days that are forecast have a non-zero precipitation chance. I’ll use the same two table and view as with the temp, wind, and humidity deltas, but this time flagging whether I recorded rain for a given hourly period.
CREATE MATERIALIZED VIEW precip_accuracy AS
SELECT
    fc.starttime,
    EXTRACT(YEAR FROM fc.starttime) AS year,
    EXTRACT(MONTH FROM fc.starttime) AS month,
    fc.precip as forecast_pop,
    CASE
        WHEN fc.precip BETWEEN 1 AND 25 THEN '1-25%'
        WHEN fc.precip BETWEEN 26 AND 50 THEN '26-50%'
        WHEN fc.precip BETWEEN 51 AND 75 THEN '51-75%'
        WHEN fc.precip BETWEEN 76 AND 100 THEN '76-100%'
    END AS pop_bucket,
    obs.rain_total_hour AS observed_precip,
    CASE WHEN obs.rain_total_hour > 0 THEN true ELSE false END AS did_rain
FROM (
    SELECT DISTINCT ON (starttime) *
    FROM home_forecast
    ORDER BY starttime, updated DESC
) fc
JOIN weather_hourly_aggs obs ON obs.period_start = fc.starttime
WHERE fc.precip > 0
AND obs.period_start < NOW();
Because this one is a materialized view, I’ll create a procedure and job to refresh it every hour.
CREATE OR REPLACE PROCEDURE refresh_precip_accuracy(jobid int, config jsonb)
    LANGUAGE SQL AS $$
        REFRESH MATERIALIZED VIEW precip_accuracy;
    $$;
SELECT add_job('refresh_precip_accuracy', '1 hour');
Then I’ll create the monthly summary like I did for the deltas.
CREATE VIEW precip_accuracy_summary AS
SELECT
    year,
    month,
    pop_bucket,
    COUNT(*) as total_hours,
    SUM(CASE WHEN did_rain THEN 1 ELSE 0 END) AS hours_rained,
    ROUND((SUM(CASE WHEN did_rain THEN 1 ELSE 0 END)::numeric / COUNT(*)) * 100, 1) AS pct_accurate
FROM precip_accuracy
GROUP BY year, month, pop_bucket
ORDER BY year, month, pop_bucket;
And finally, I’ll create a view that shows me when rain was not forecast but a rain event was recorded.
CREATE VIEW precip_surprise AS
SELECT
    fc.starttime,
    EXTRACT(YEAR FROM fc.starttime) AS year,
    EXTRACT(MONTH FROM fc.starttime) AS month,
    obs.rain_total_hour AS observed_precip
FROM (
    SELECT DISTINCT ON (starttime) *
    FROM home_forecast
    ORDER BY starttime, updated DESC
) fc
JOIN weather_hourly_aggs obs ON obs.period_start = fc.starttime
WHERE fc.precip = 0
AND obs.rain_total_hour > 0
AND obs.period_start < NOW();
And finally, I’ll hop back into Grafana to create some dashboard panels.
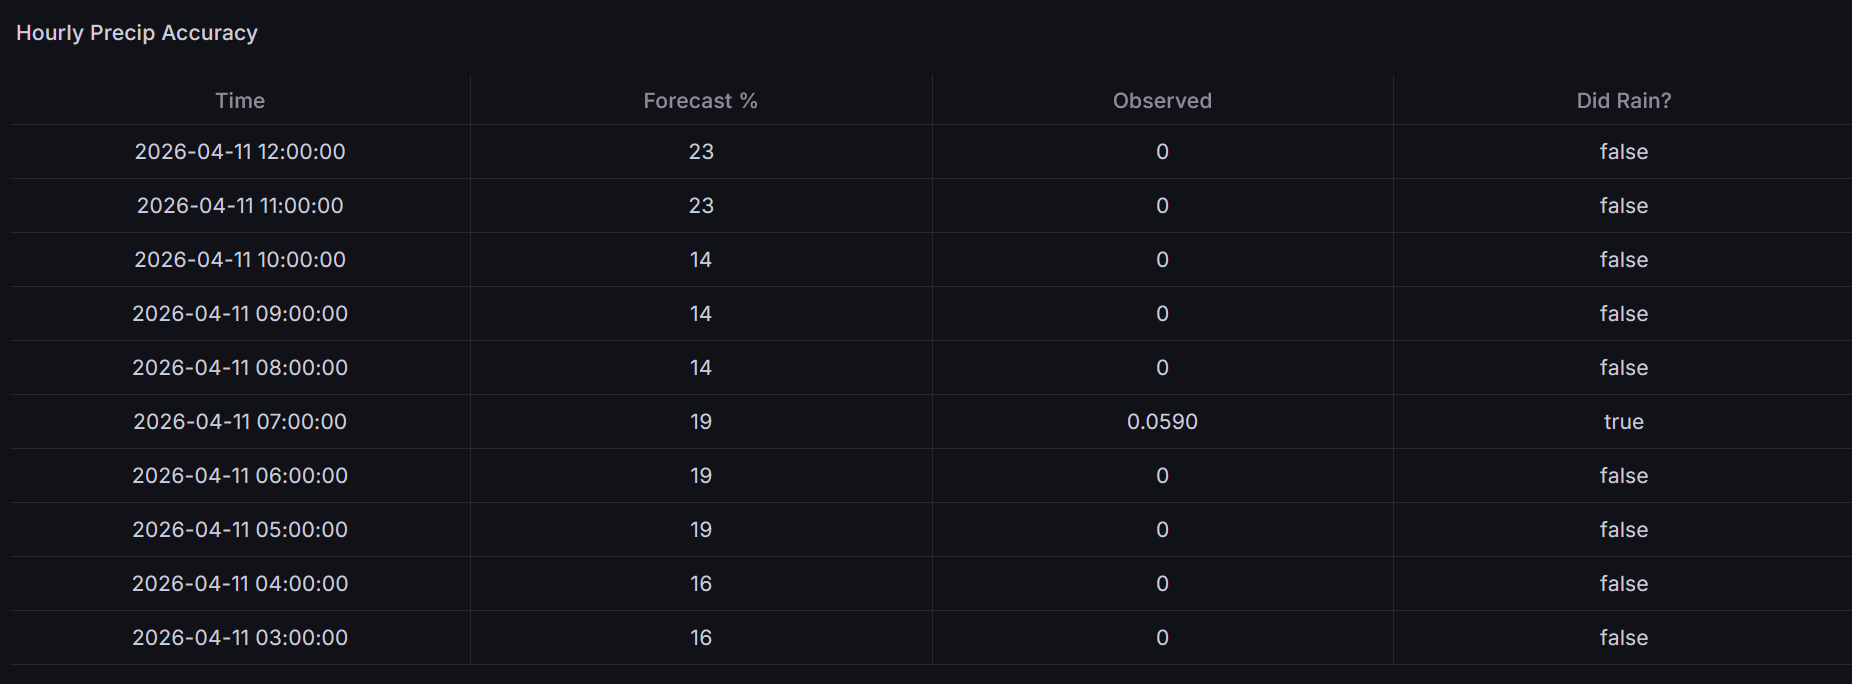
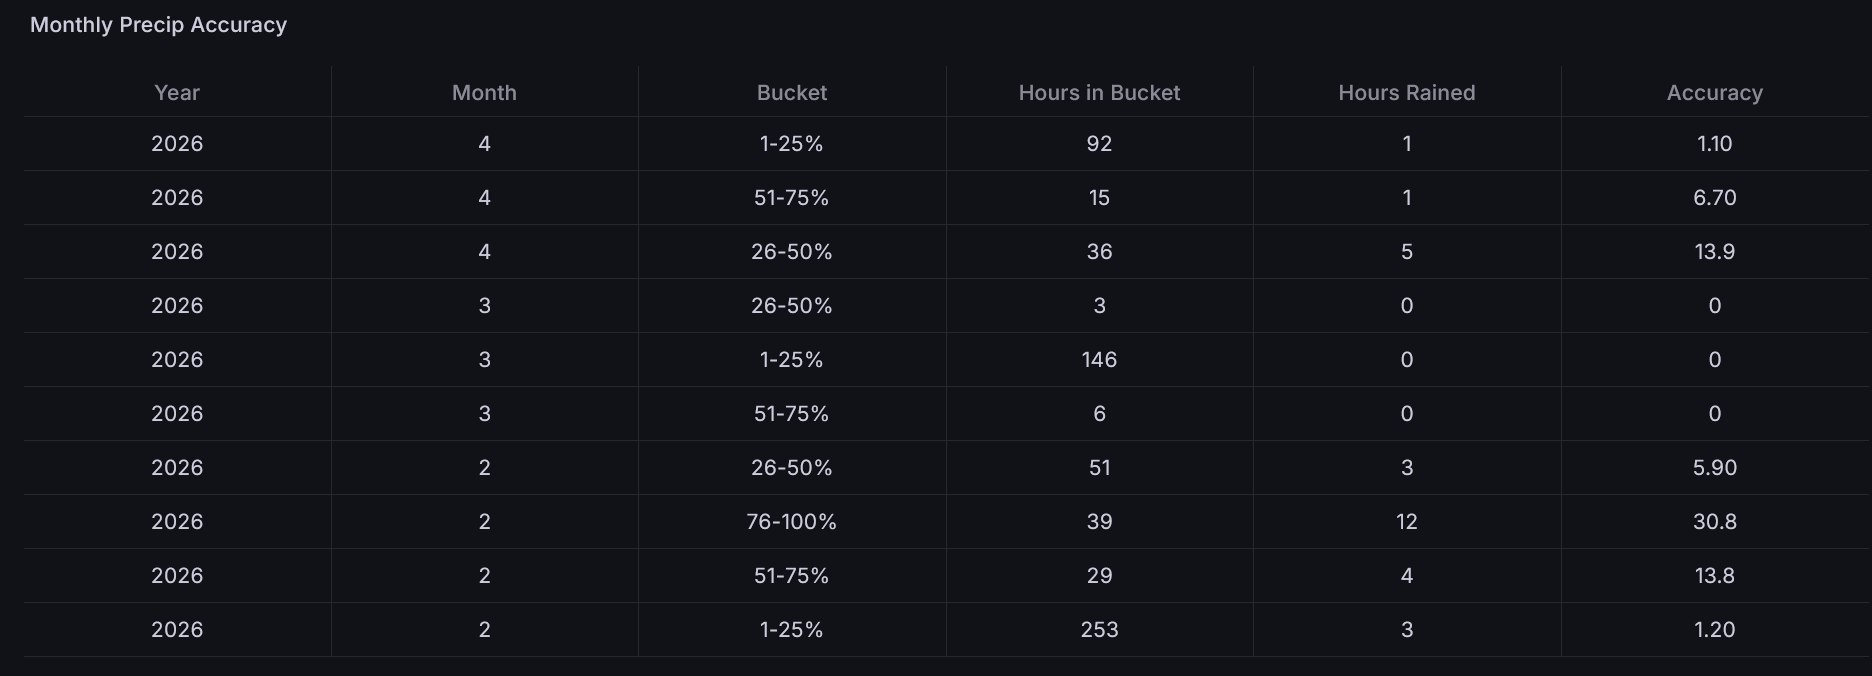
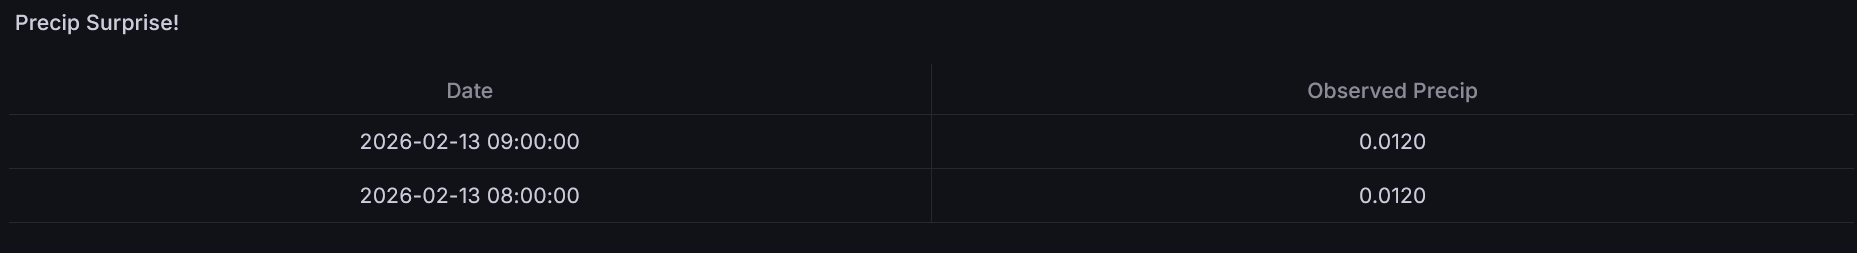
Again, these are quick and dirty dashboards that I’ll polish later as I have time, but they get the job done and are displaying my data to help me make decisions about when to water my plants (or right now with my grape vines still in buckets and not in their permanent containers, when to bring them into the garage to avoid a freeze and when to plant them in their permanent containers).